Analyze Imagery in Visual Analysis
Visual Analysis is where you can browse, visualize, and analyze your Planet data collections directly in the browser, no downloads or additional software required. Select your area and time of interest to inspect your Planet orders, switch between visualization layers and acquisition dates, and navigate your data spatially, all from a single interactive map. To learn more about Visual Analysis, visit Planet University - Introduction to the Visual Analysis Application.
Visual Analysis is currently in beta and will eventually replace the Browser application. If you are already familiar with Browser, you will find improved collection-based workflow here with a streamlined interface and new capabilities, including SuperRes for PlanetScope Scenes.
Getting Started
To open Visual Analysis, go to Analyze > Visual Analysis (BETA) from within Planet Insights Platform, or click here.
You need an active Planet Insights Platform account with processing units to get started.
The interface has three main areas:
- Left panel: Data Collection selector, Configuration dropdown, Visualization layer, and date controls.
- Center: An interactive map with location search on top.
- Right panel: AOI drawing tools, download tool, and measurement tools.
Browsing Your Data Collections
Start by selecting your Configurations from the Configurations dropdown in the left panel.
After selection:
- The list of data collections used in the selected Configuration appears.
- AOI footprint geometries appear as overlays on the map, so you can see at a glance where your data is located.
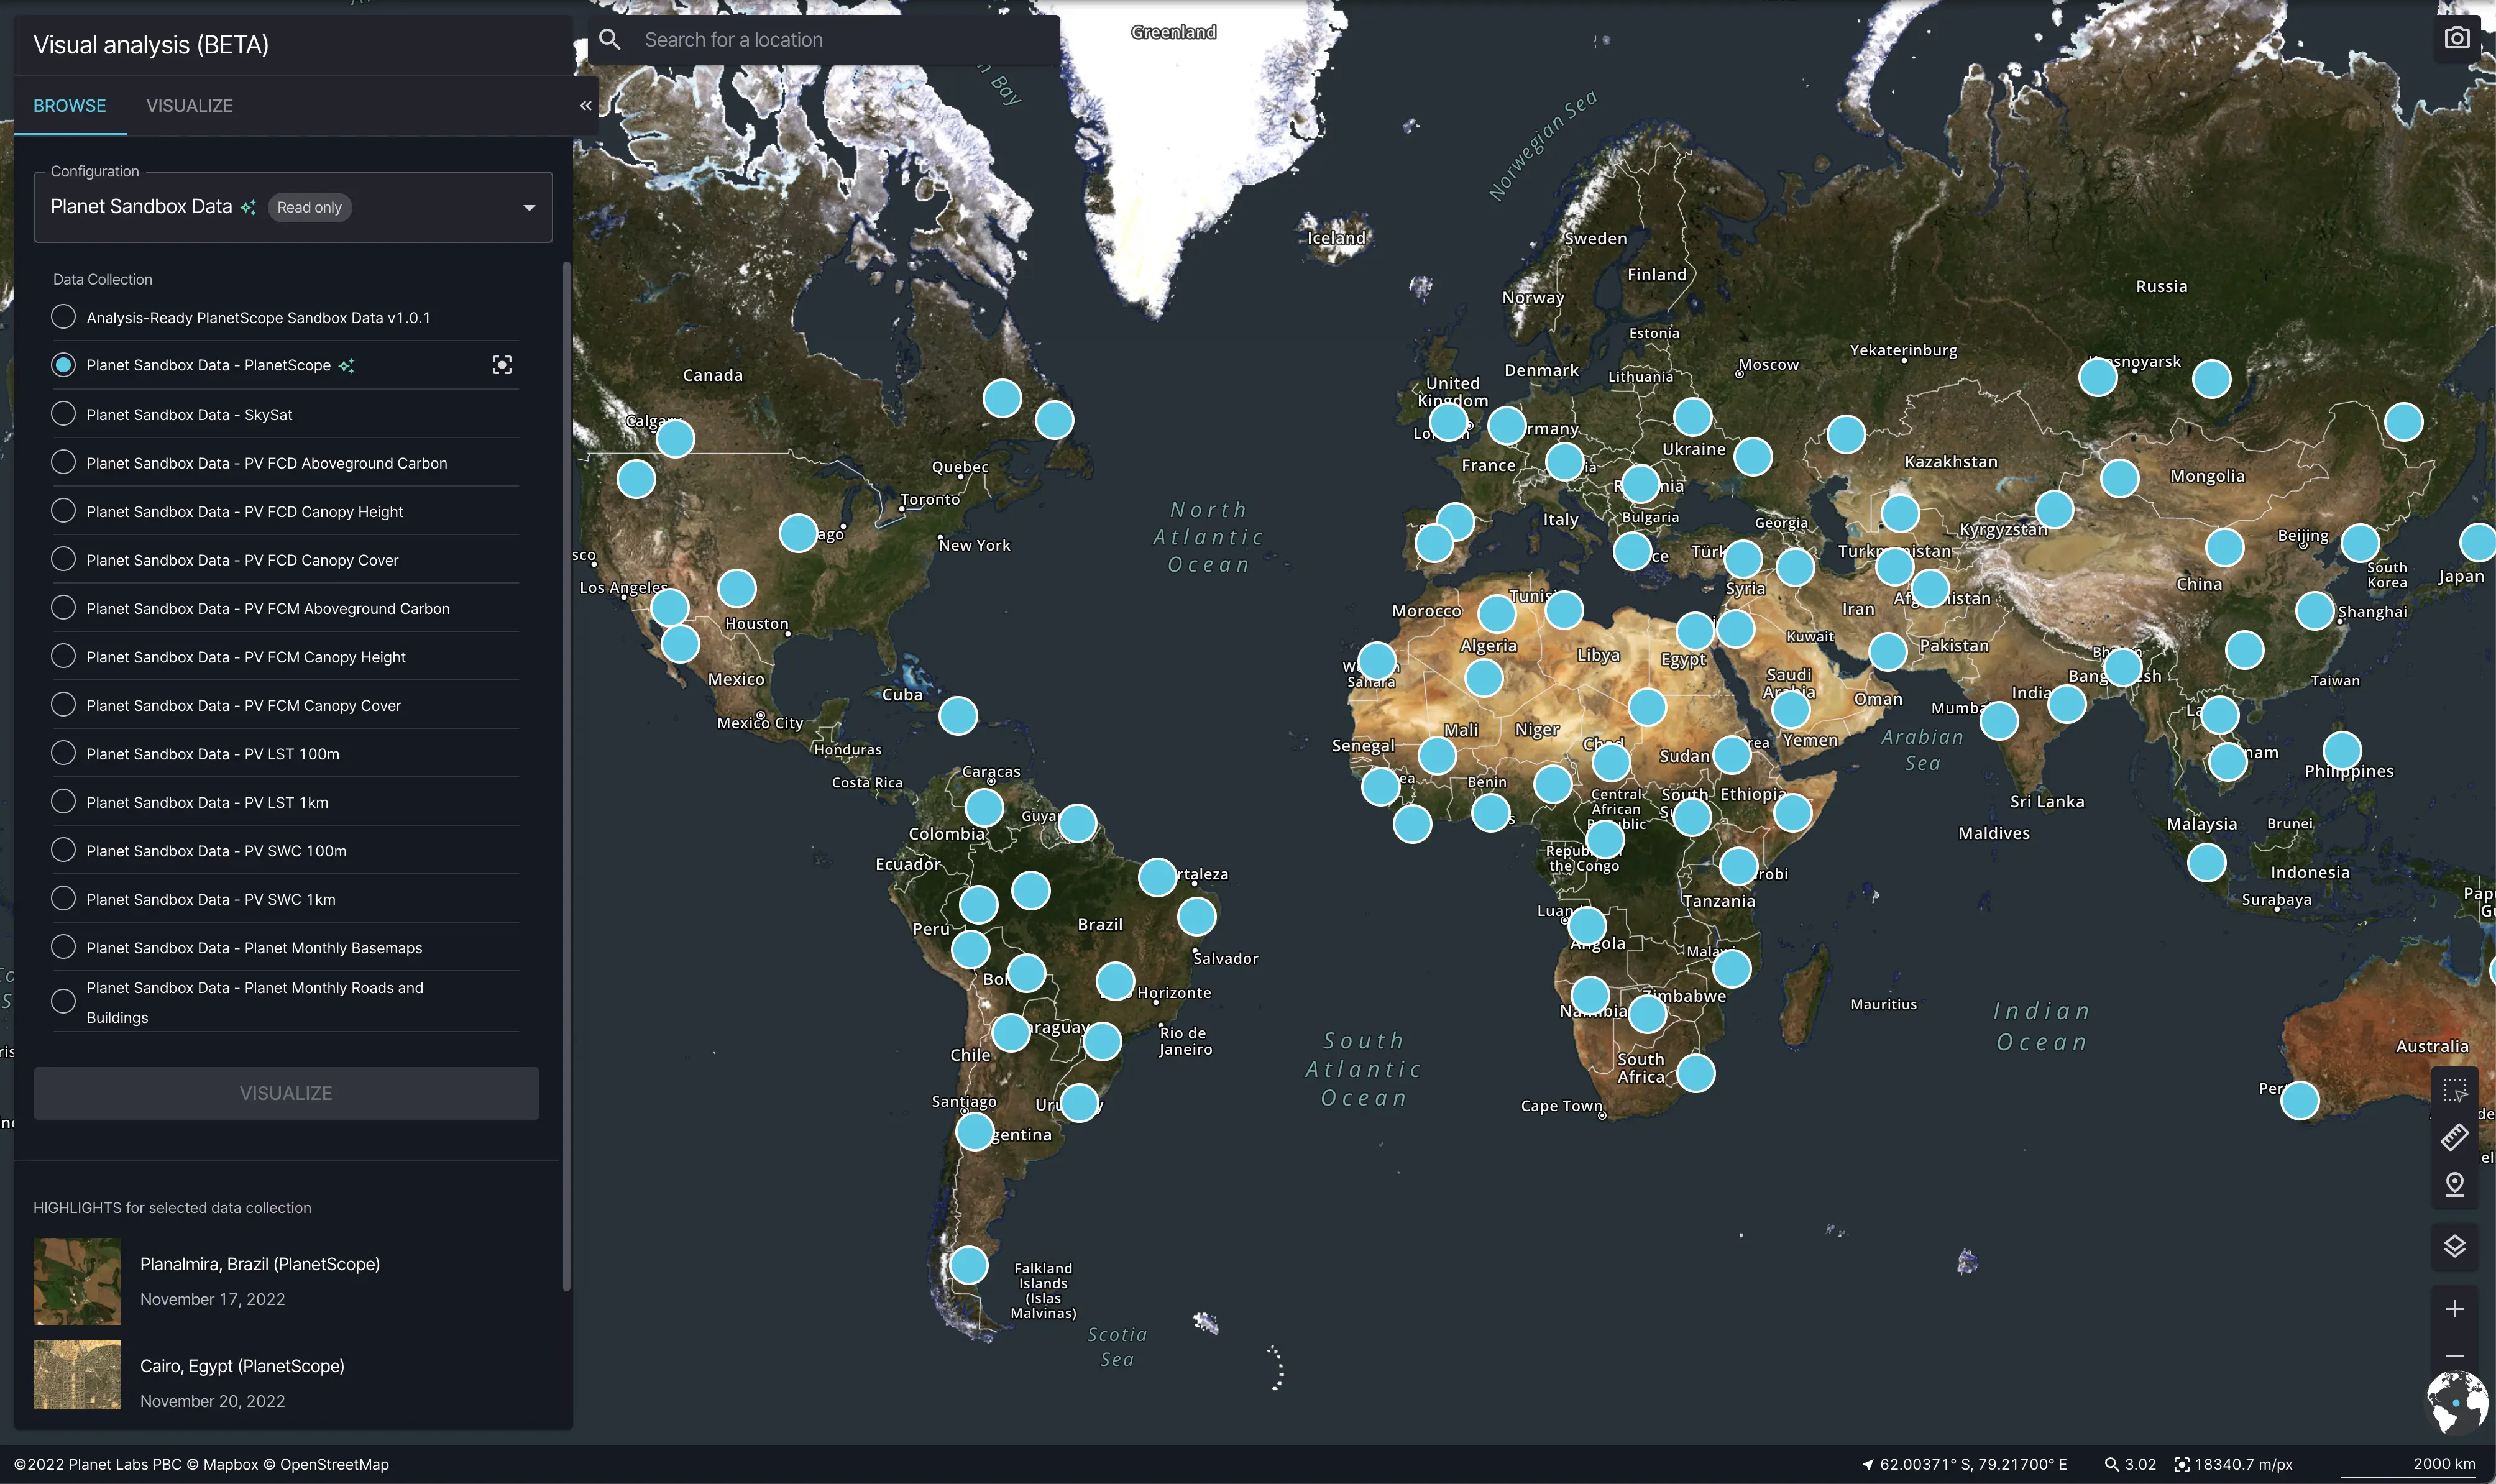
Visual Analysis showing the AOI footprint geometries on the map
To fit the entire map view to your collection's spatial extent, click Zoom to collection extent .
Visualization Layers and Date Controls
After selecting a Configuration and Data Collection, click on the VISUALIZE button to visualize the selection on the map. The selected configuration controls which visualization layers are available — for example, a PlanetScope collection may offer True Color, False Color (NIR), and NDVI layers.
Use the Settings and effects panel under the layers to fine-tune the rendering.
Visual Analysis left panel showing Visualization layer controls
Date Controls
Visual Analysis offers two date modes:
- Single Date : View imagery for a single acquisition date. Use the Previous available date and Next available date buttons to step through available scenes. Only dates with data in the selected collection are shown.
- Timespan (Visualization date range): Set a Start date (UTC) and End date (UTC) to view a mosaic composed of all scenes acquired within that period.
When multiple scenes overlap the same area, Mosaicking order determines which pixel is shown on top. Most recent mosaicking order is automatically applied and shows the latest acquisition for each pixel.
Cloud filtering is supported on public data. To filter out cloudy data adjust the Cloud Cover Threshold. Only scenes at or below the threshold will be included in the visualization.
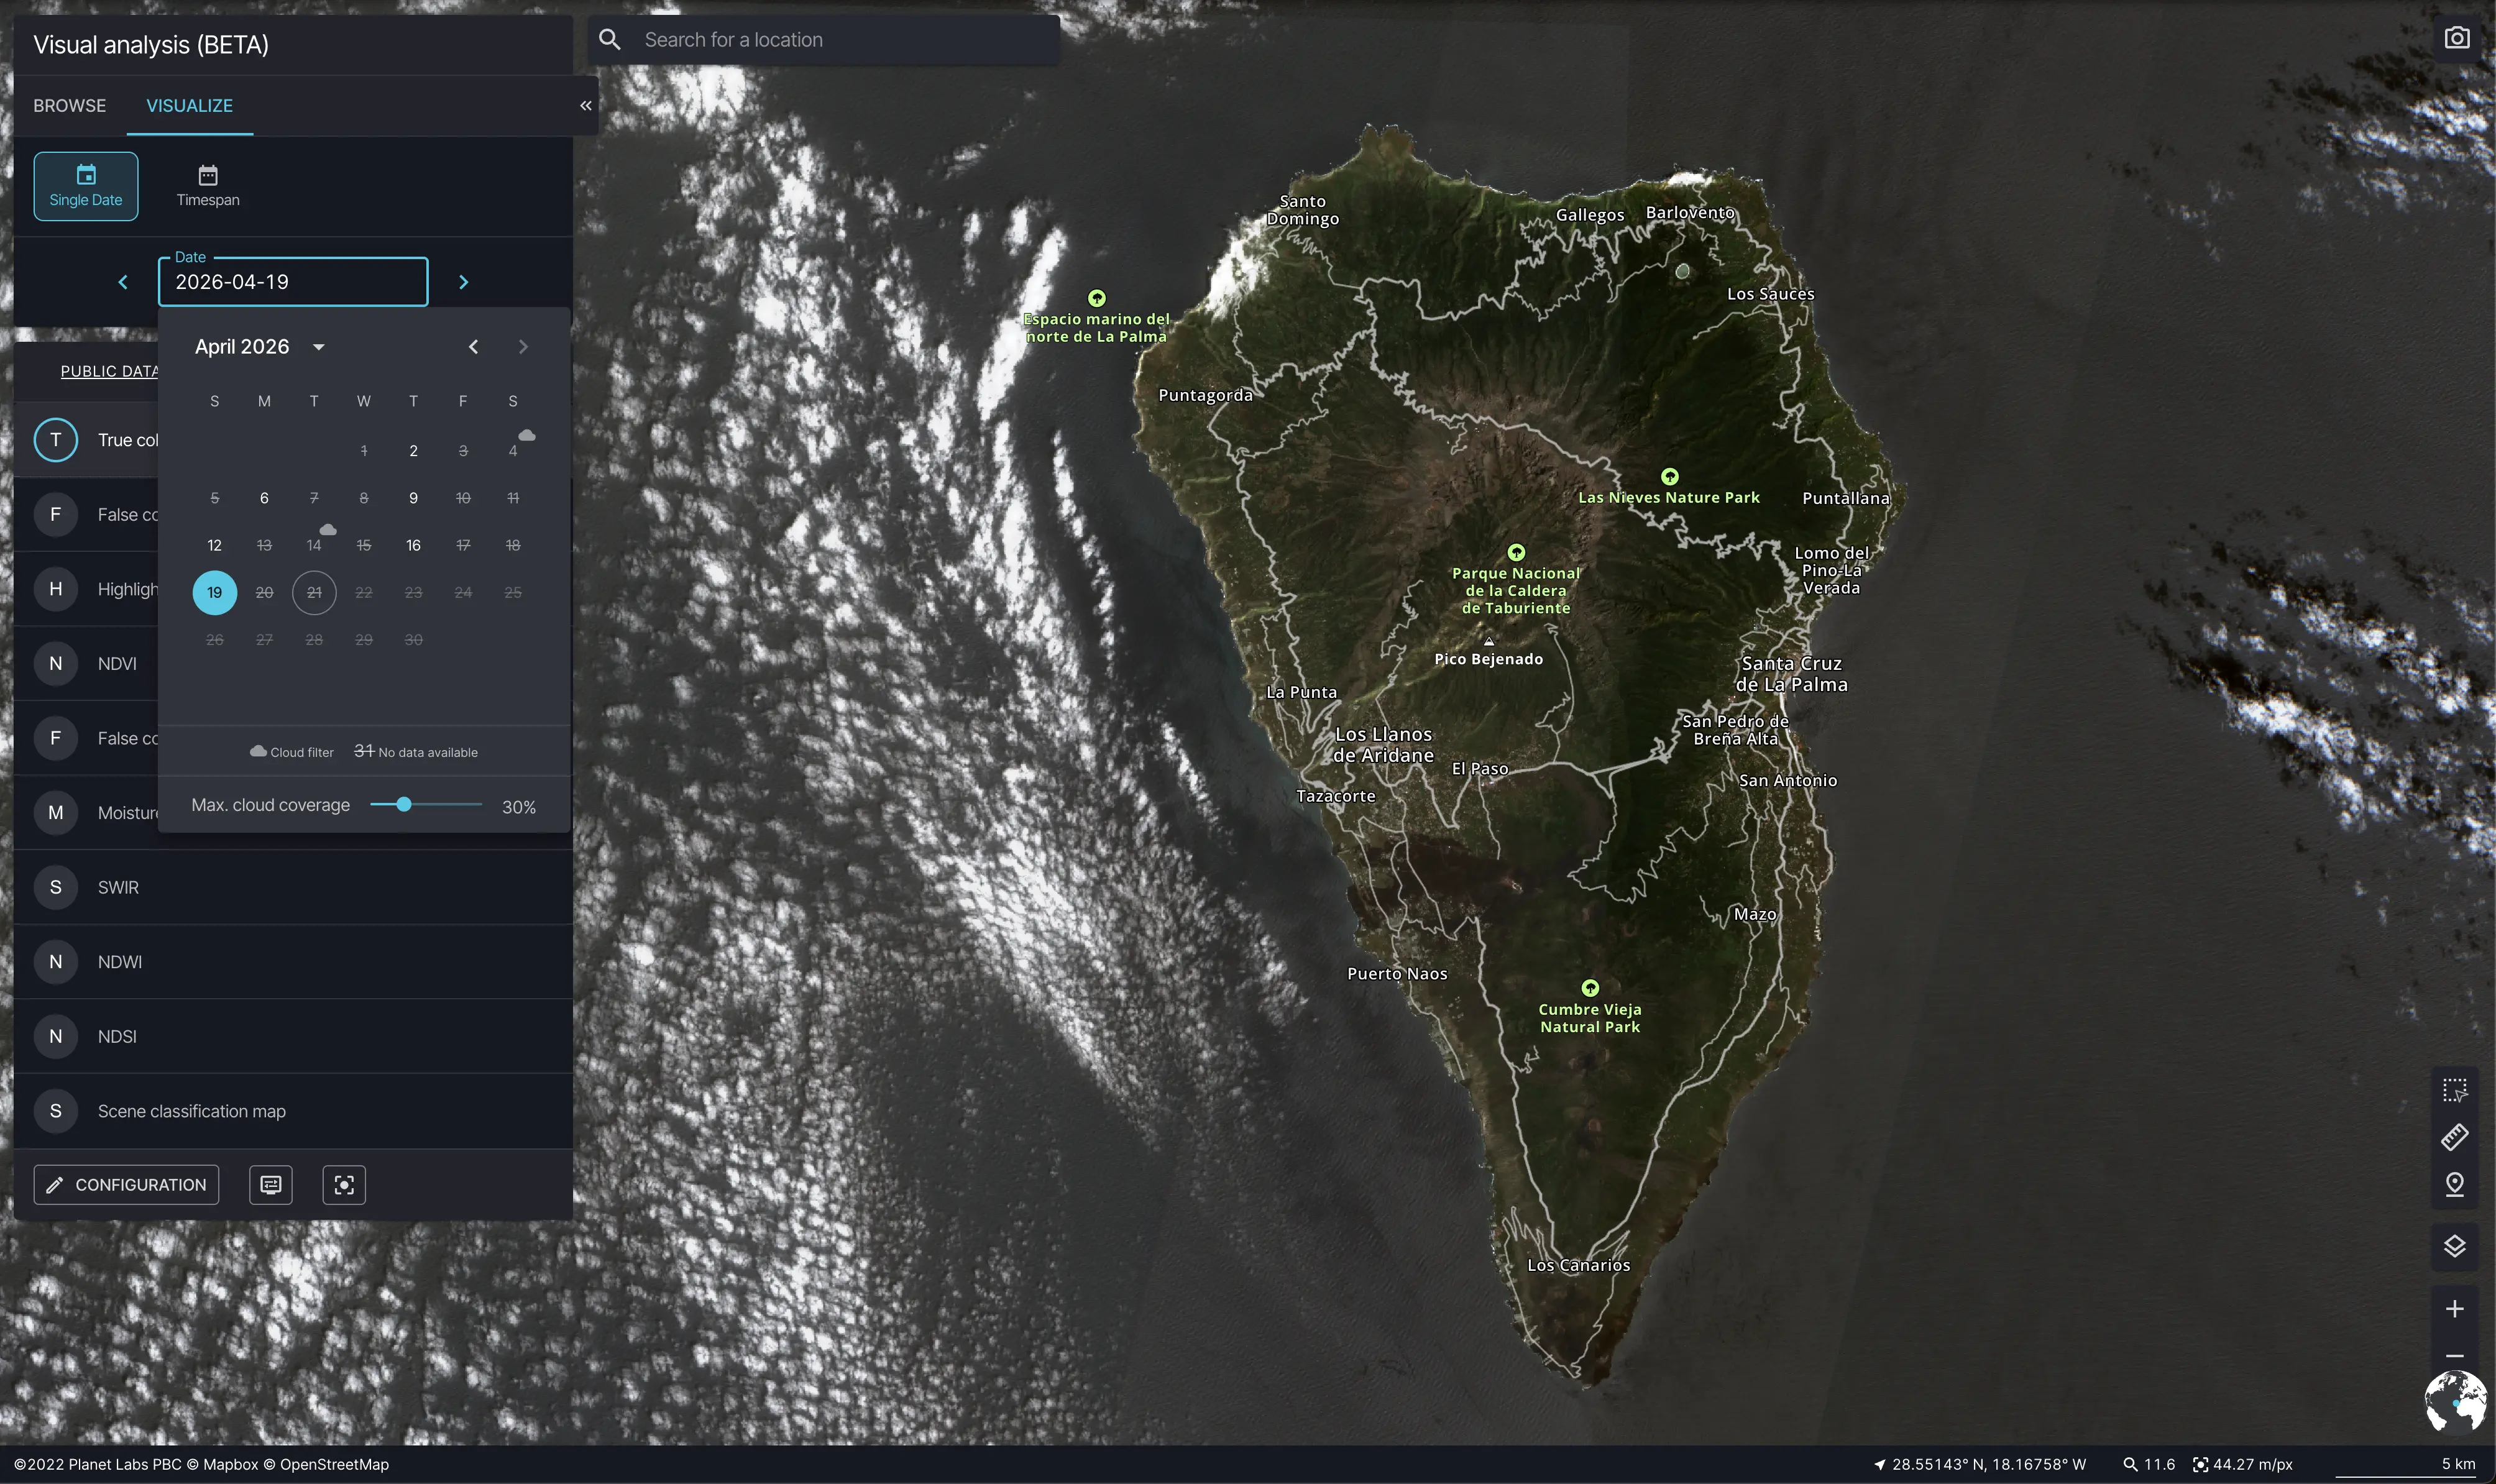
Visual Analysis left panel showing cloud filtering on date controls.
SuperRes Scenes: Enhanced Visualization
SuperRes Scenes is an enhancement available for PlanetScope data that increases visual detail beyond the native sensor resolution, helping you see more in imagery you have already ordered. Read more in Planet SuperRes: A Technical Overview.
Compatible PlanetScope Scenes
To be able to use SuperRes on top of your PlanetScope data, you need to order TOAR (ortho_analytic_4b_sr) or SR assets (ortho_analytic_4b) in a data collection. We currently support two different AI models that were trained on top of the following PSScene assets:
ortho_analytic_4b_srandortho_analytic_4b.
The AI model is automatically selected based on asset type in your data collection. All compatible data collections have SuperRes hint .
Applying SuperRes
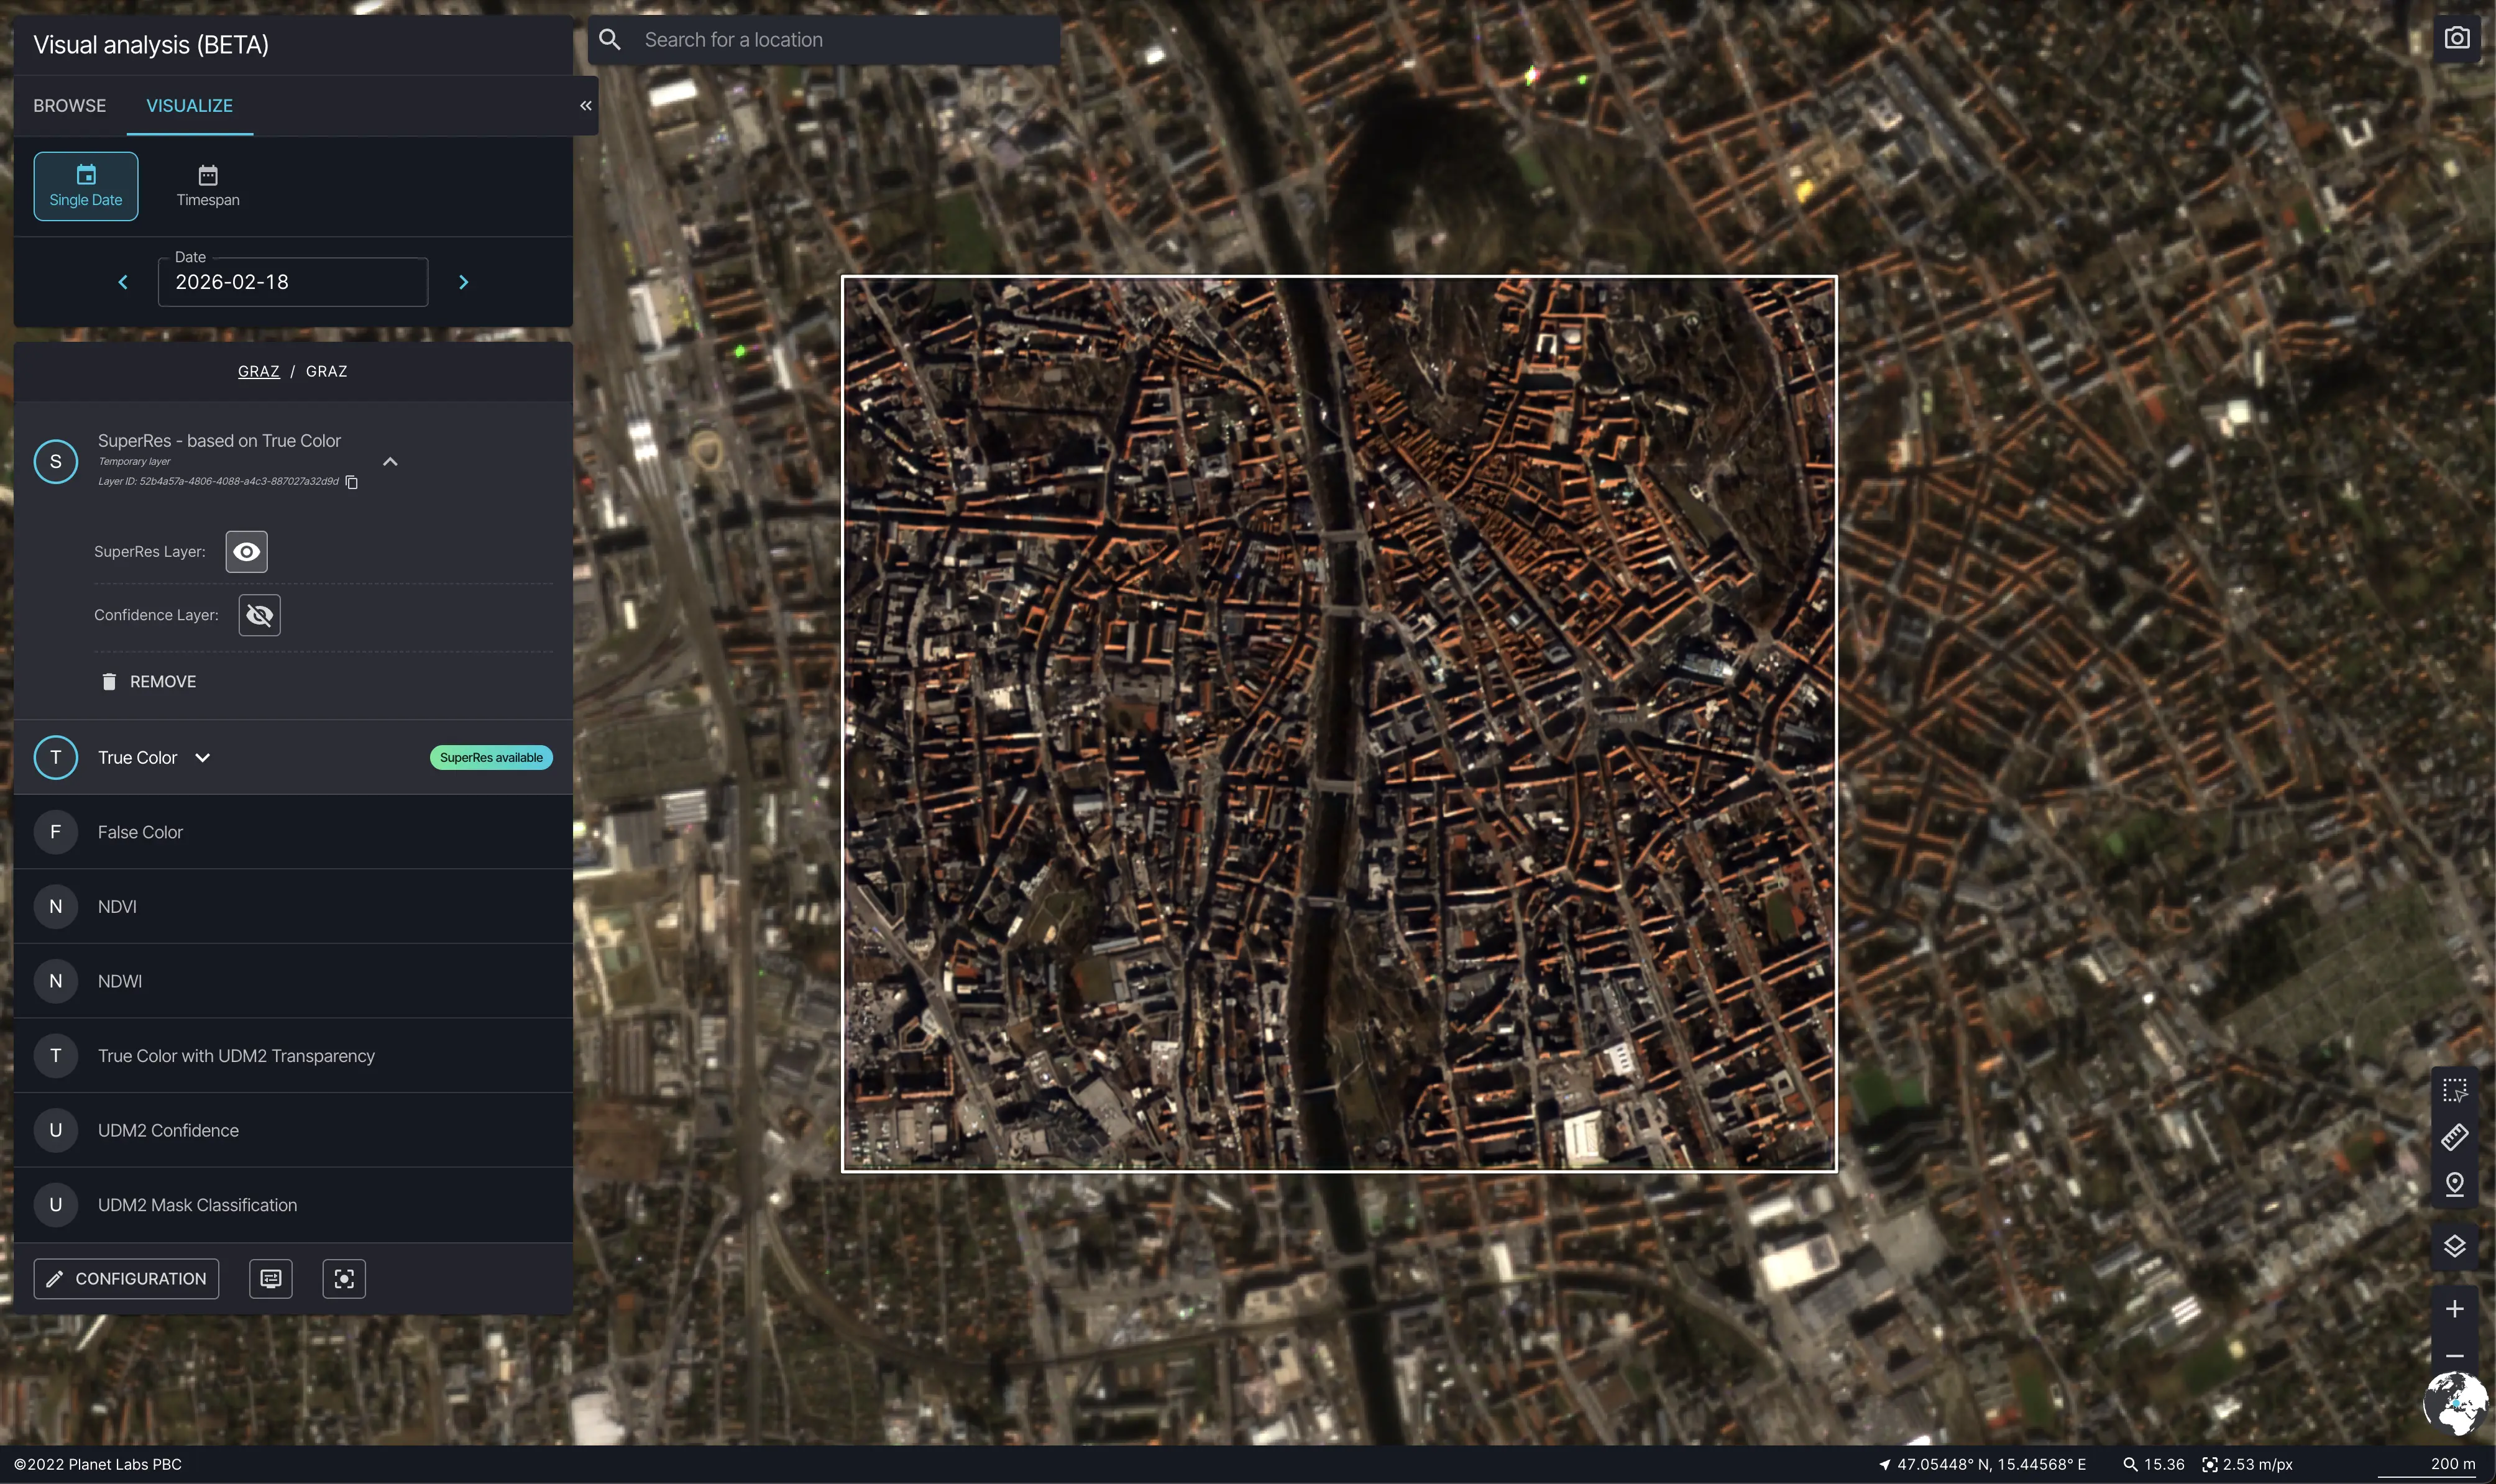
When a compatible PlanetScope collection is visualized, the SuperRes tag appears in the left panel on True color layer. To apply SuperRes:
Draw an area of interest on the map using one of the AOI tools in the map toolbar.
Once your AOI is drawn, click SuperRes under AOI tool, which triggers processing and creates temporary layers in left side panel.
Use toggle on the SuperRes layer to turn on and off enhanced visualization without losing your processed data for selected AOI.
The AOI must intersect with the collection extent, and its area must be within the supported size limit (min = 0.5 km2, max = 10 km2). If the area is too large, the tool displays a warning immediately and the request will not be submitted.
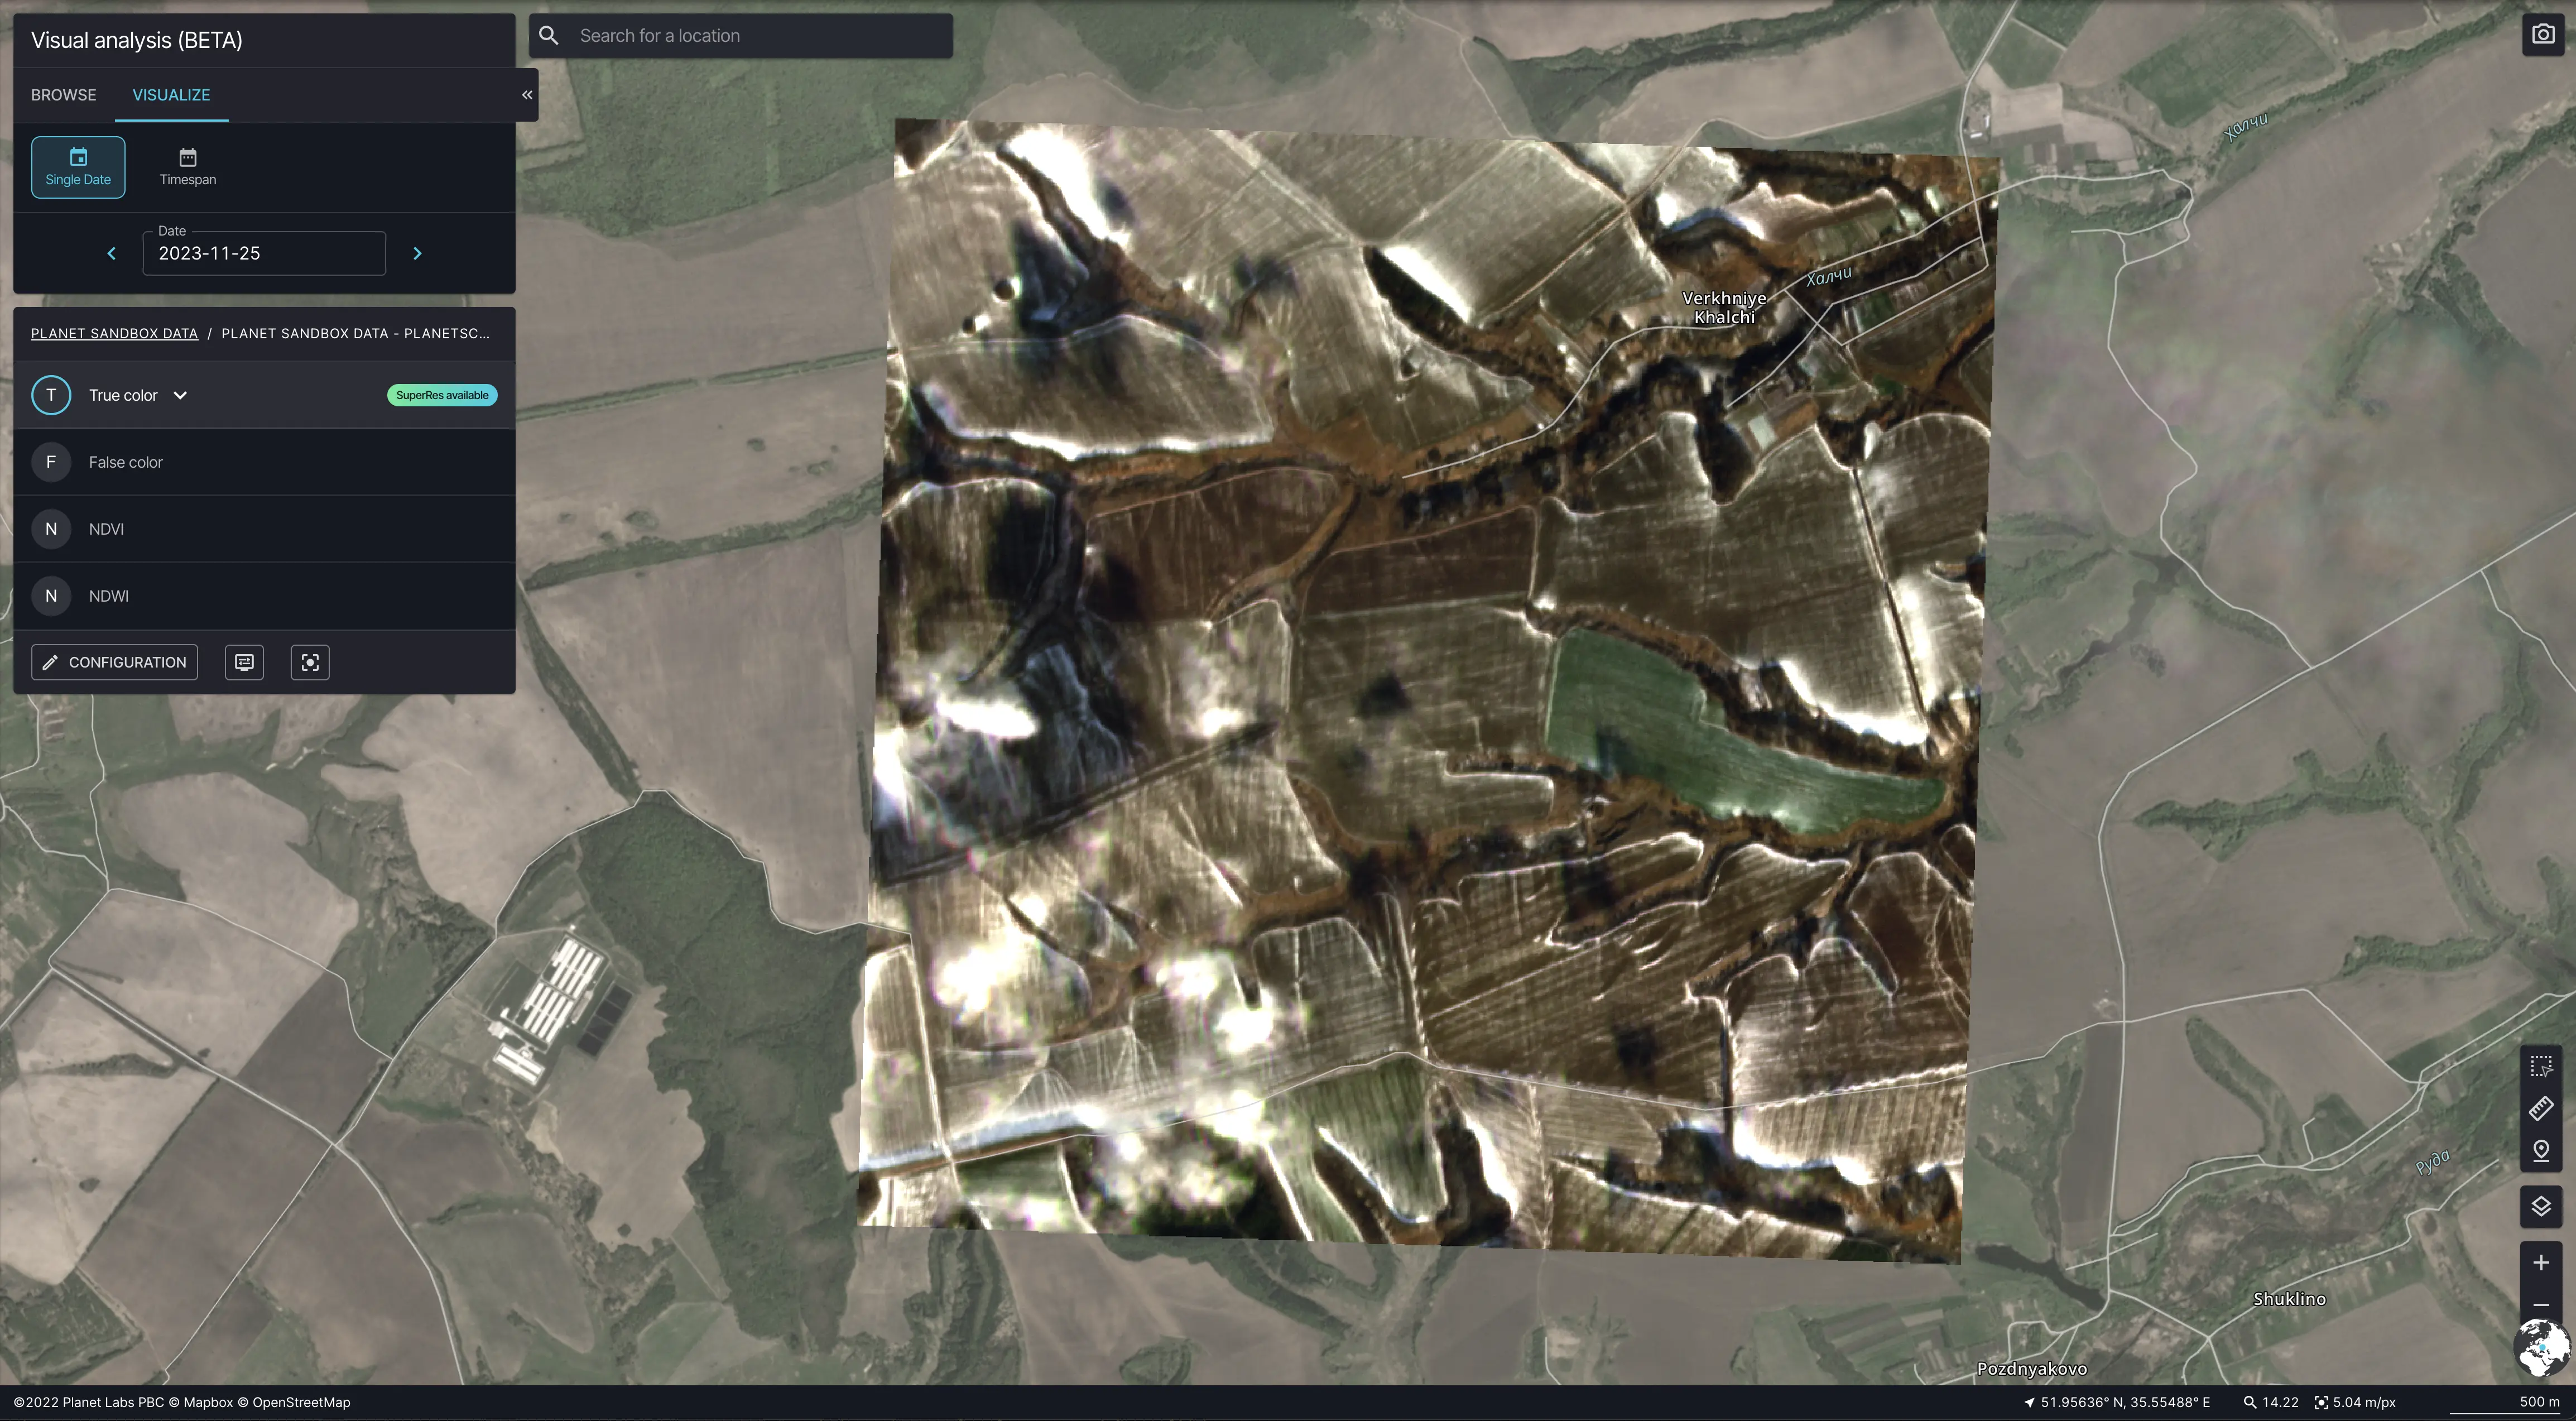
Visual Analysis showing SuperRes applied to a PlanetScope collection with the enhanced layer visible on the map
Confidence Layer
SuperRes includes a Confidence Layer that shows how reliable the enhancement is for each pixel.
Use toggle to turn on Confidence layer in the SuperRes Layer controls to overlay the confidence map on the enhanced visualization. A legend in the map view explains what each color level represents — higher confidence means the SuperRes result for that pixel is more accurate.
You can also adjust the SuperRes confidence threshold to hide pixels that fall below a chosen reliability level, focusing your analysis on the most trustworthy areas. Click Hide confidence to remove the overlay.
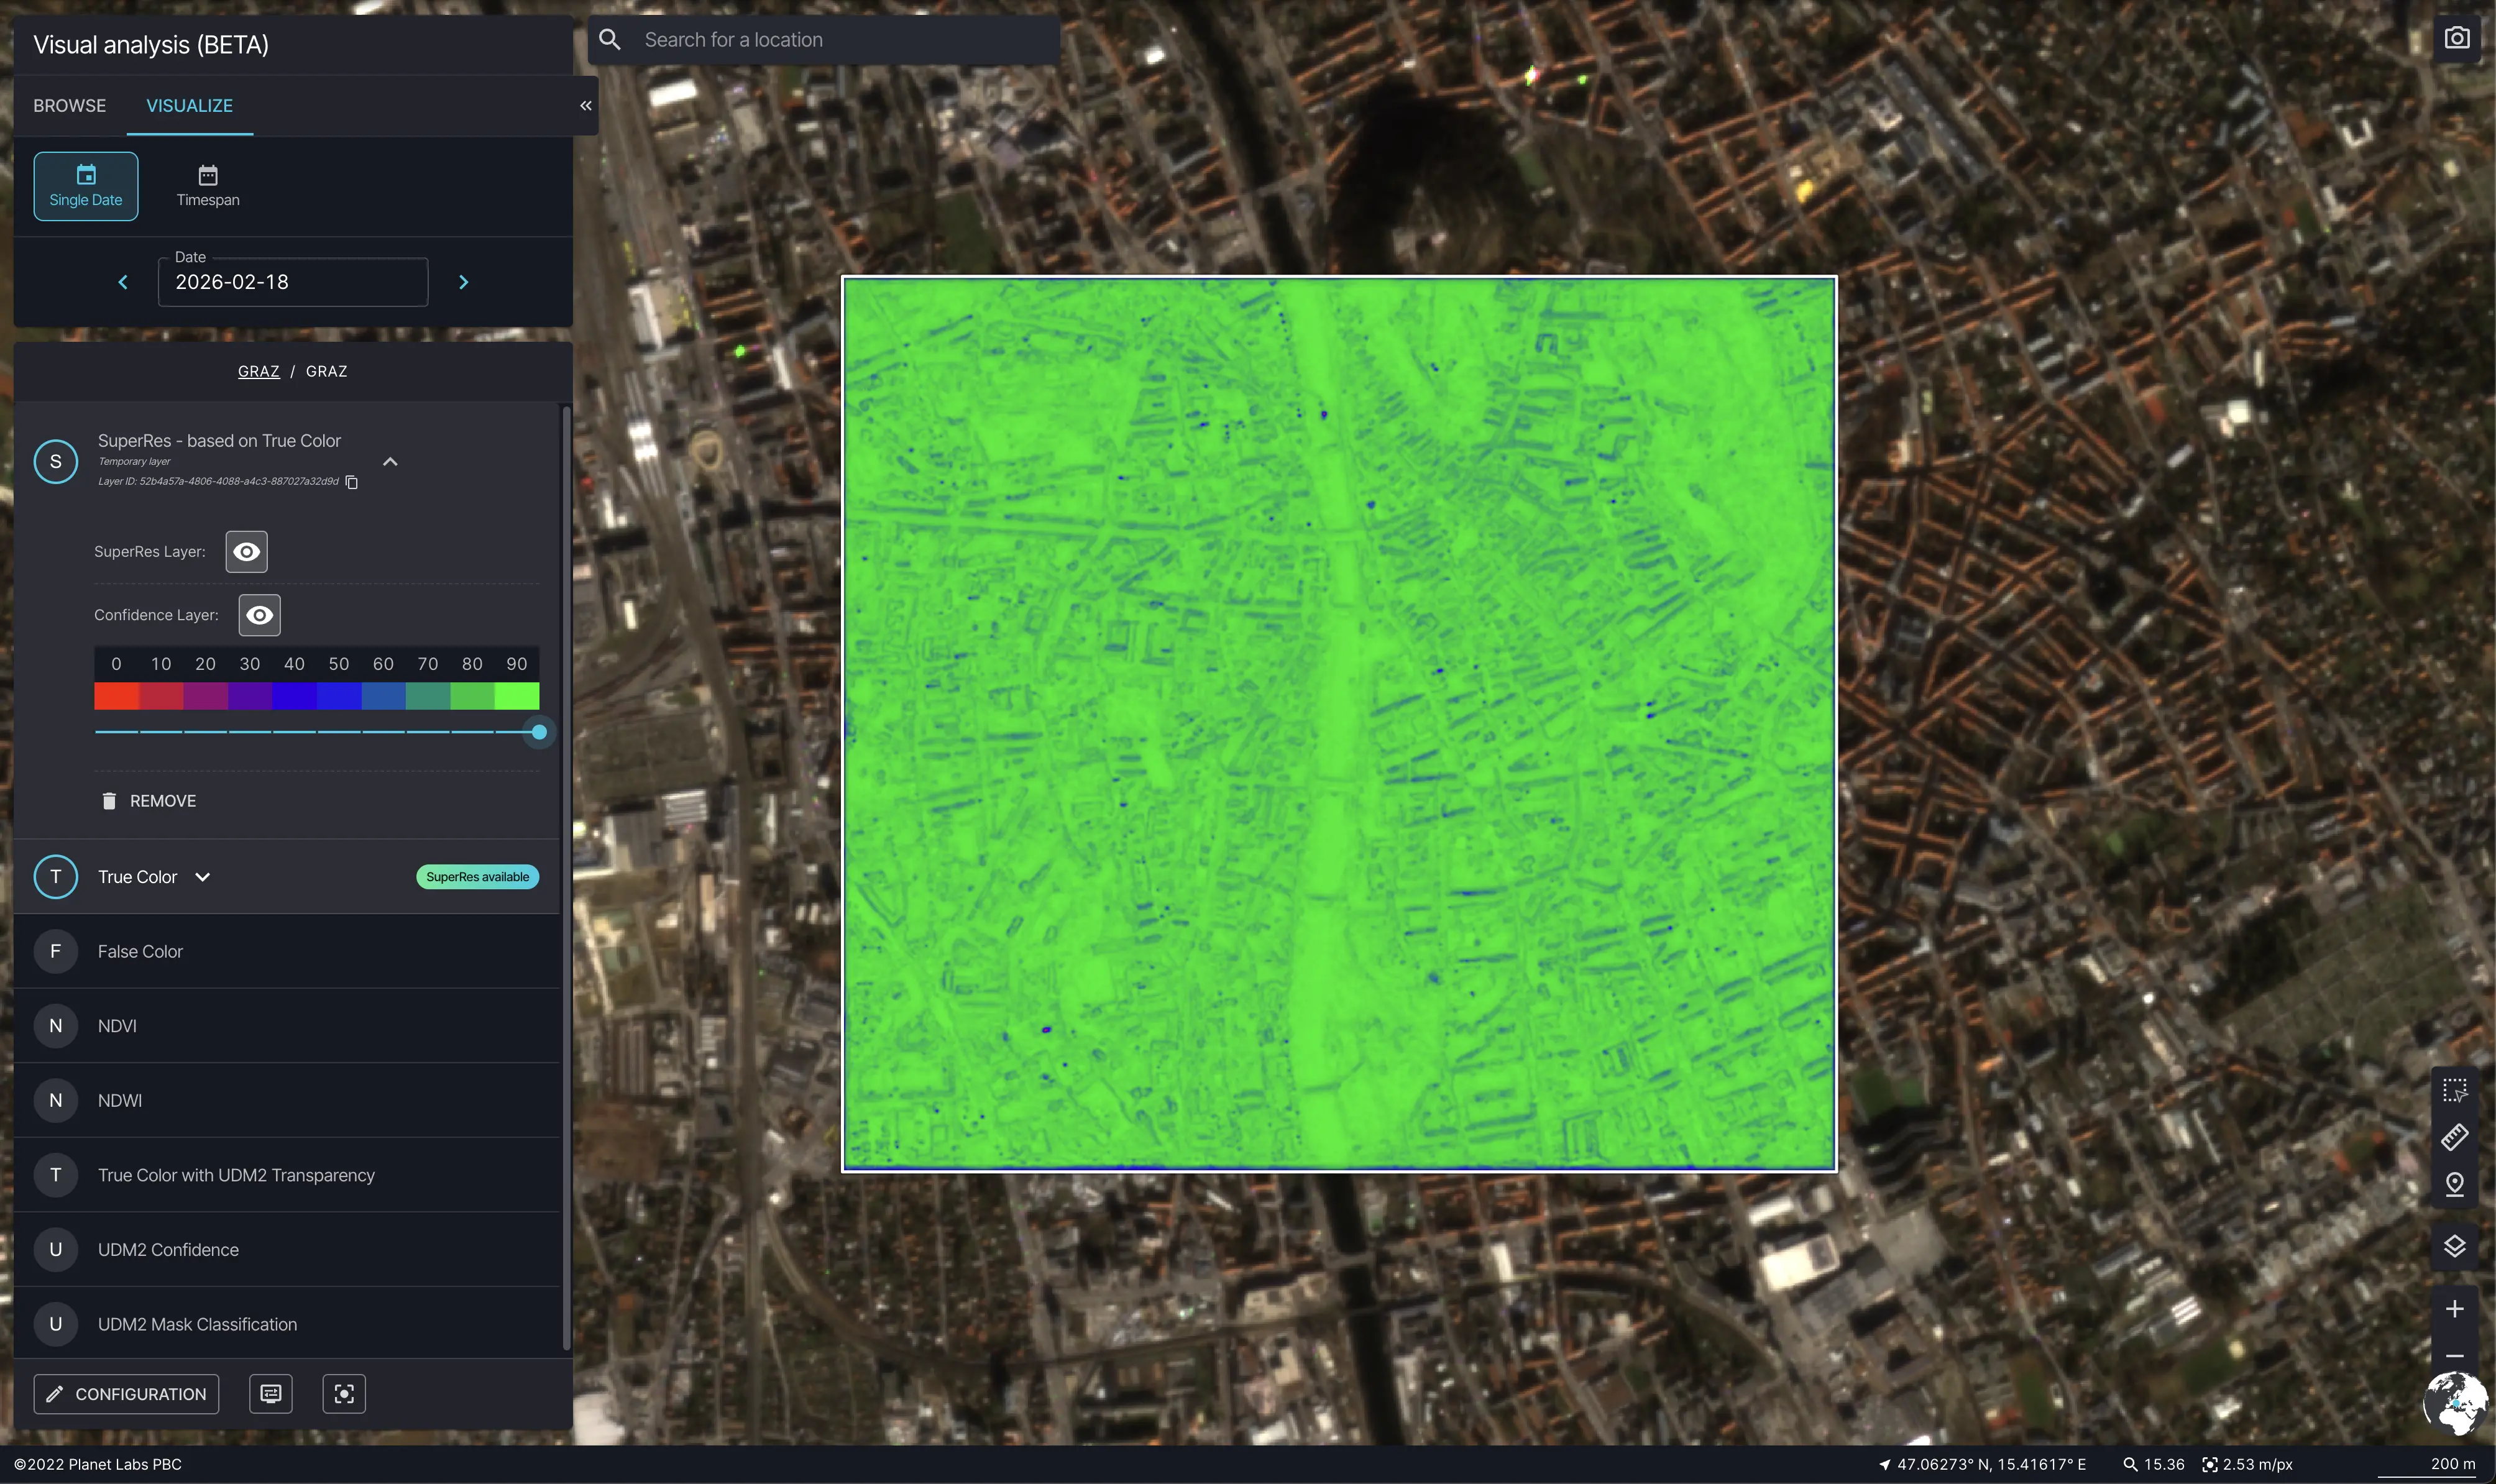
Visual Analysis showing the SuperRes Confidence Layer overlay with legend visible
Statistical Analysis
To get statistical information for a time series evolution of visualized indices (for example, NDVI) over an area or pixel, select the pixel using the picker or outline the area using the AOI tool.
This capability is only applicable to layers with one output component (for example, indices, single band products, planetary variables, etc.).
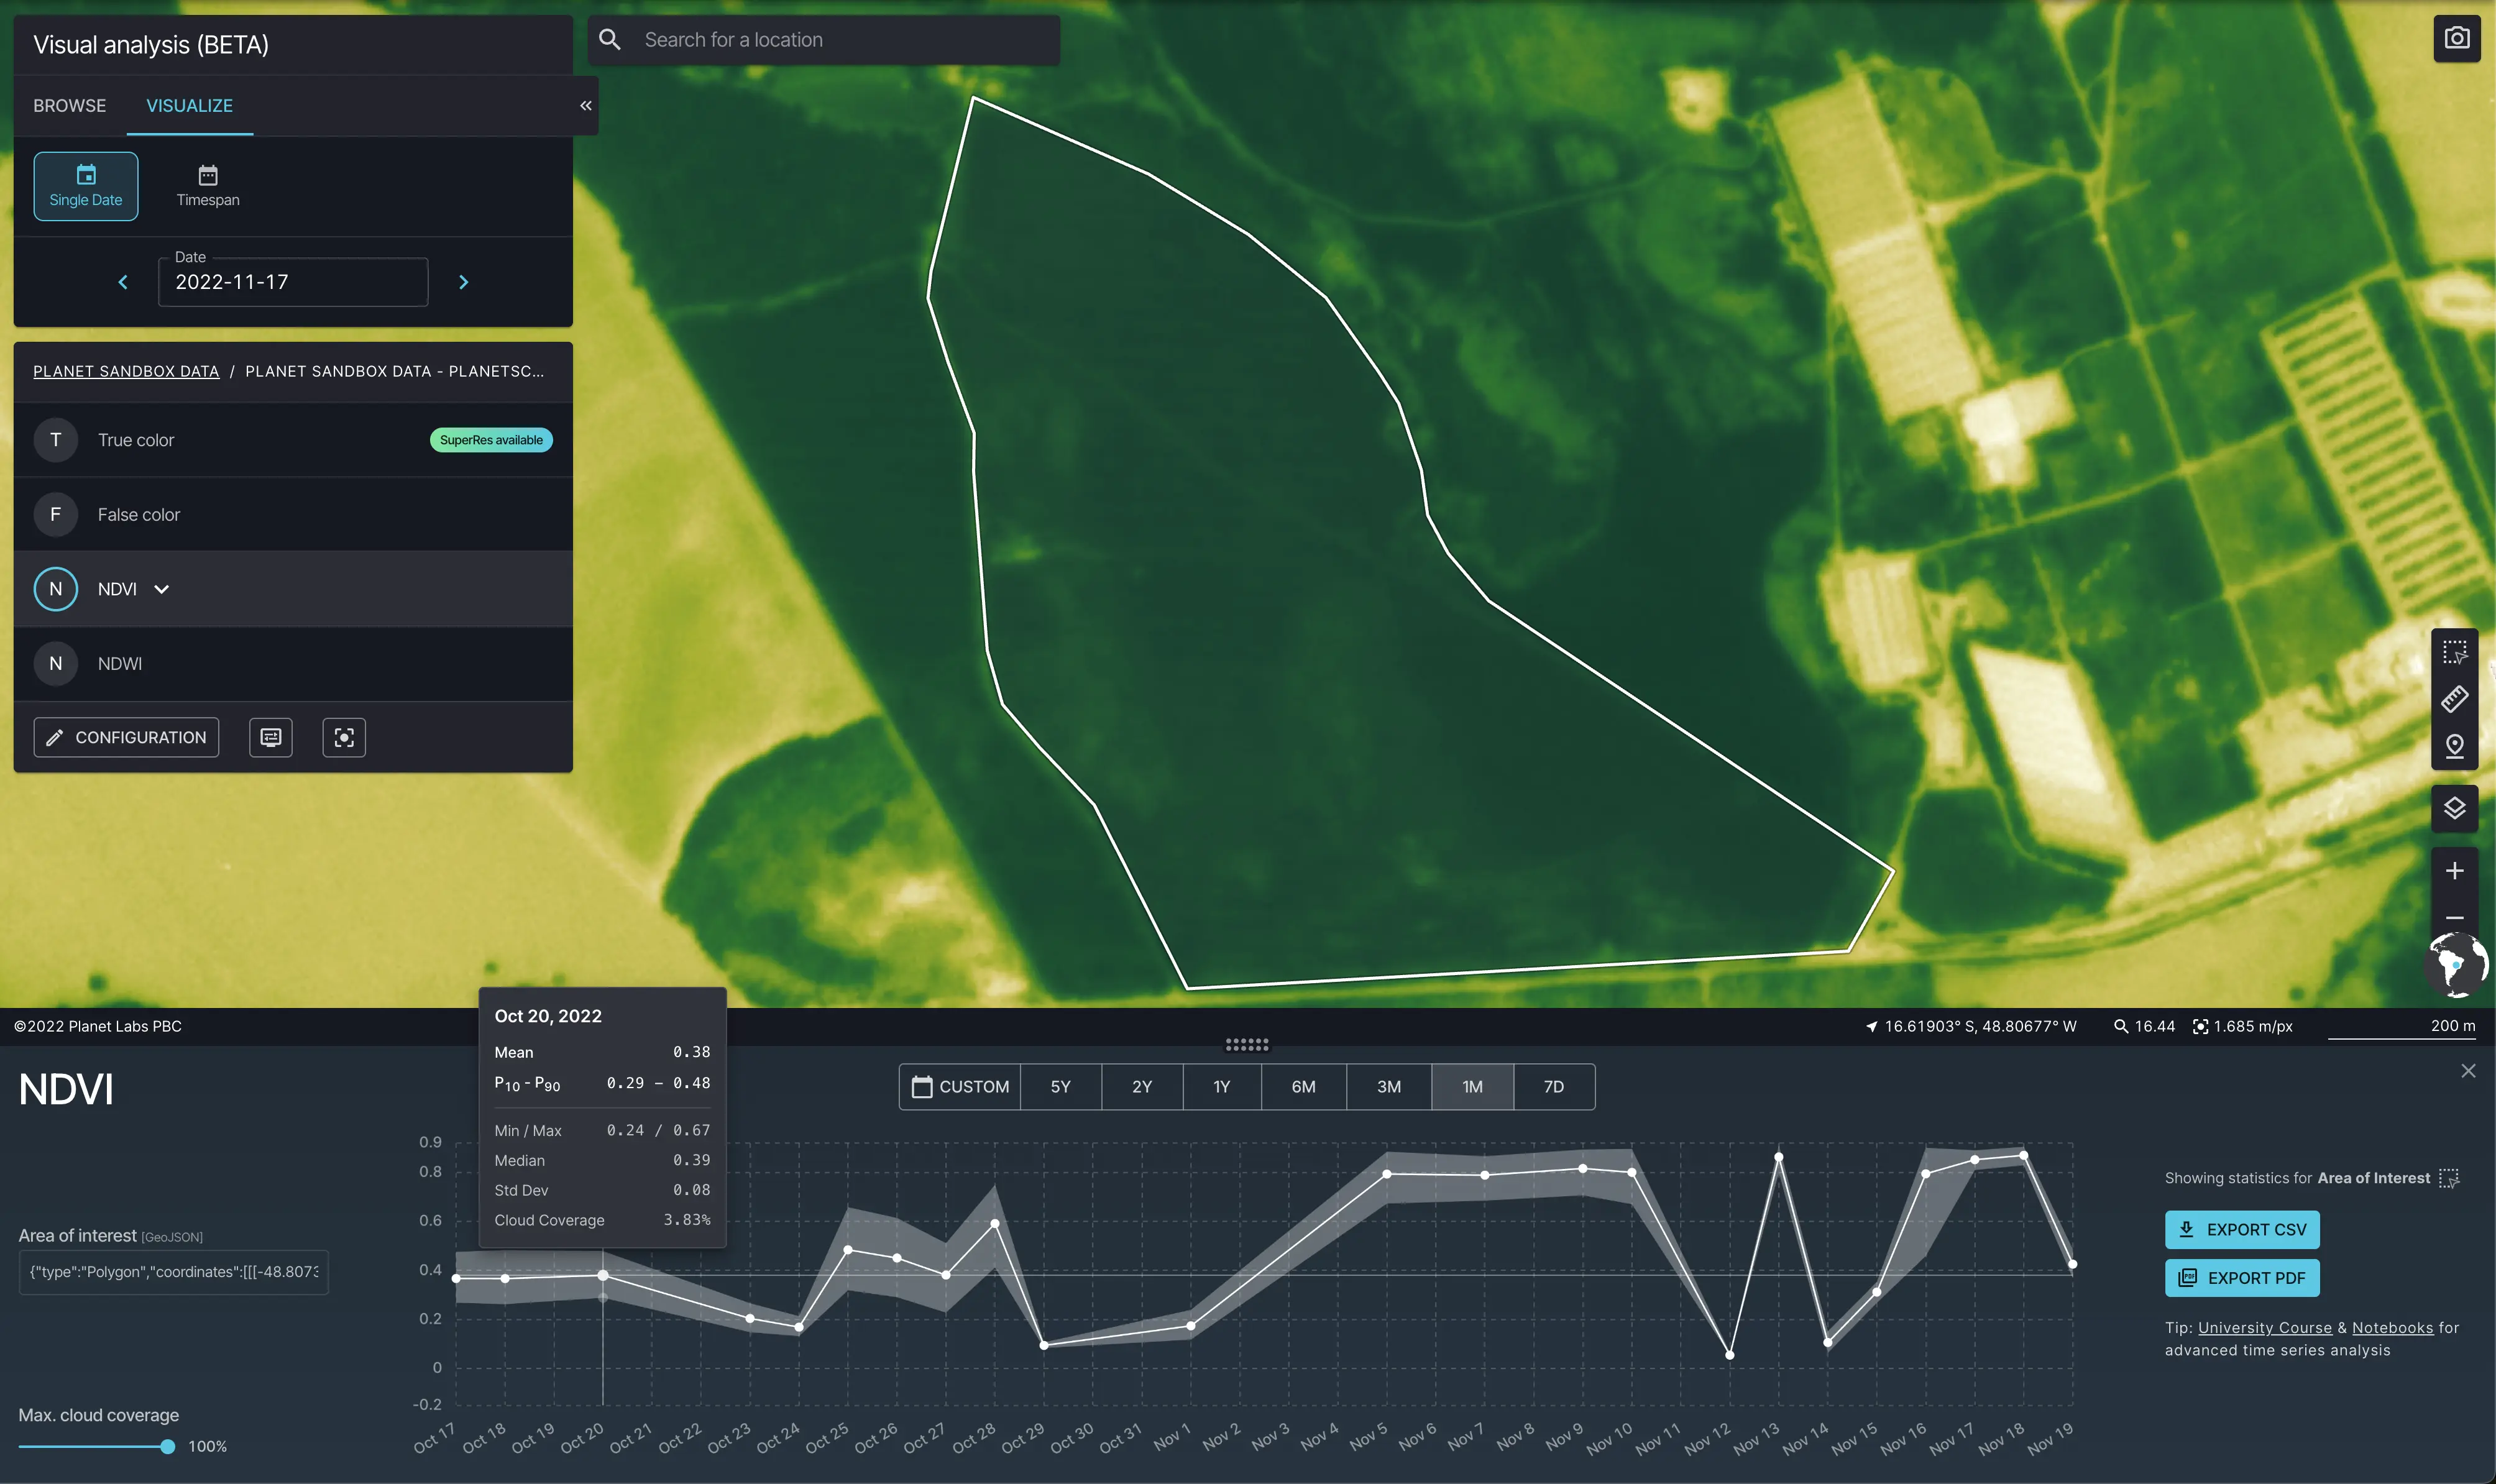
Statistical analysis over selected AOI on top of NDVI layer.
Depending on the data source, Browser allows you to filter out data points based on the cloud cover.
Downloading Imagery
The download feature is reserved exclusively for SuperRes visualizations. To export imagery to your local machine, follow the workflow outlined below.
Define your Area of Interest (AOI): Use the drawing tools to create an AOI over your PlanetScope Scenes. This boundary defines the specific spatial extent of the data to be exported.
Processing and Export Options: Once your AOI is established, you can choose between two methods:
- Preview and Process: Generate the SuperRes visualization within the platform first to verify the results.
- Direct Export: Download the SuperRes imagery directly as a GeoTIFF to your local storage.
Technical Specifications
Imagery is exported in the GeoTIFF format, providing georeferenced data ready for use in professional GIS software.
Band Mapping
The exported file contains three spectral bands. When importing the file into GIS tools (such as QGIS or ArcGIS), please ensure the bands are mapped correctly to maintain visual integrity:
| Band | Channel |
|---|---|
| Band 1 | Blue |
| Band 2 | Green |
| Band 3 | Red |
Ensure your GIS software is configured to follow this BGR (Blue, Green, Red) sequence for accurate visualization.
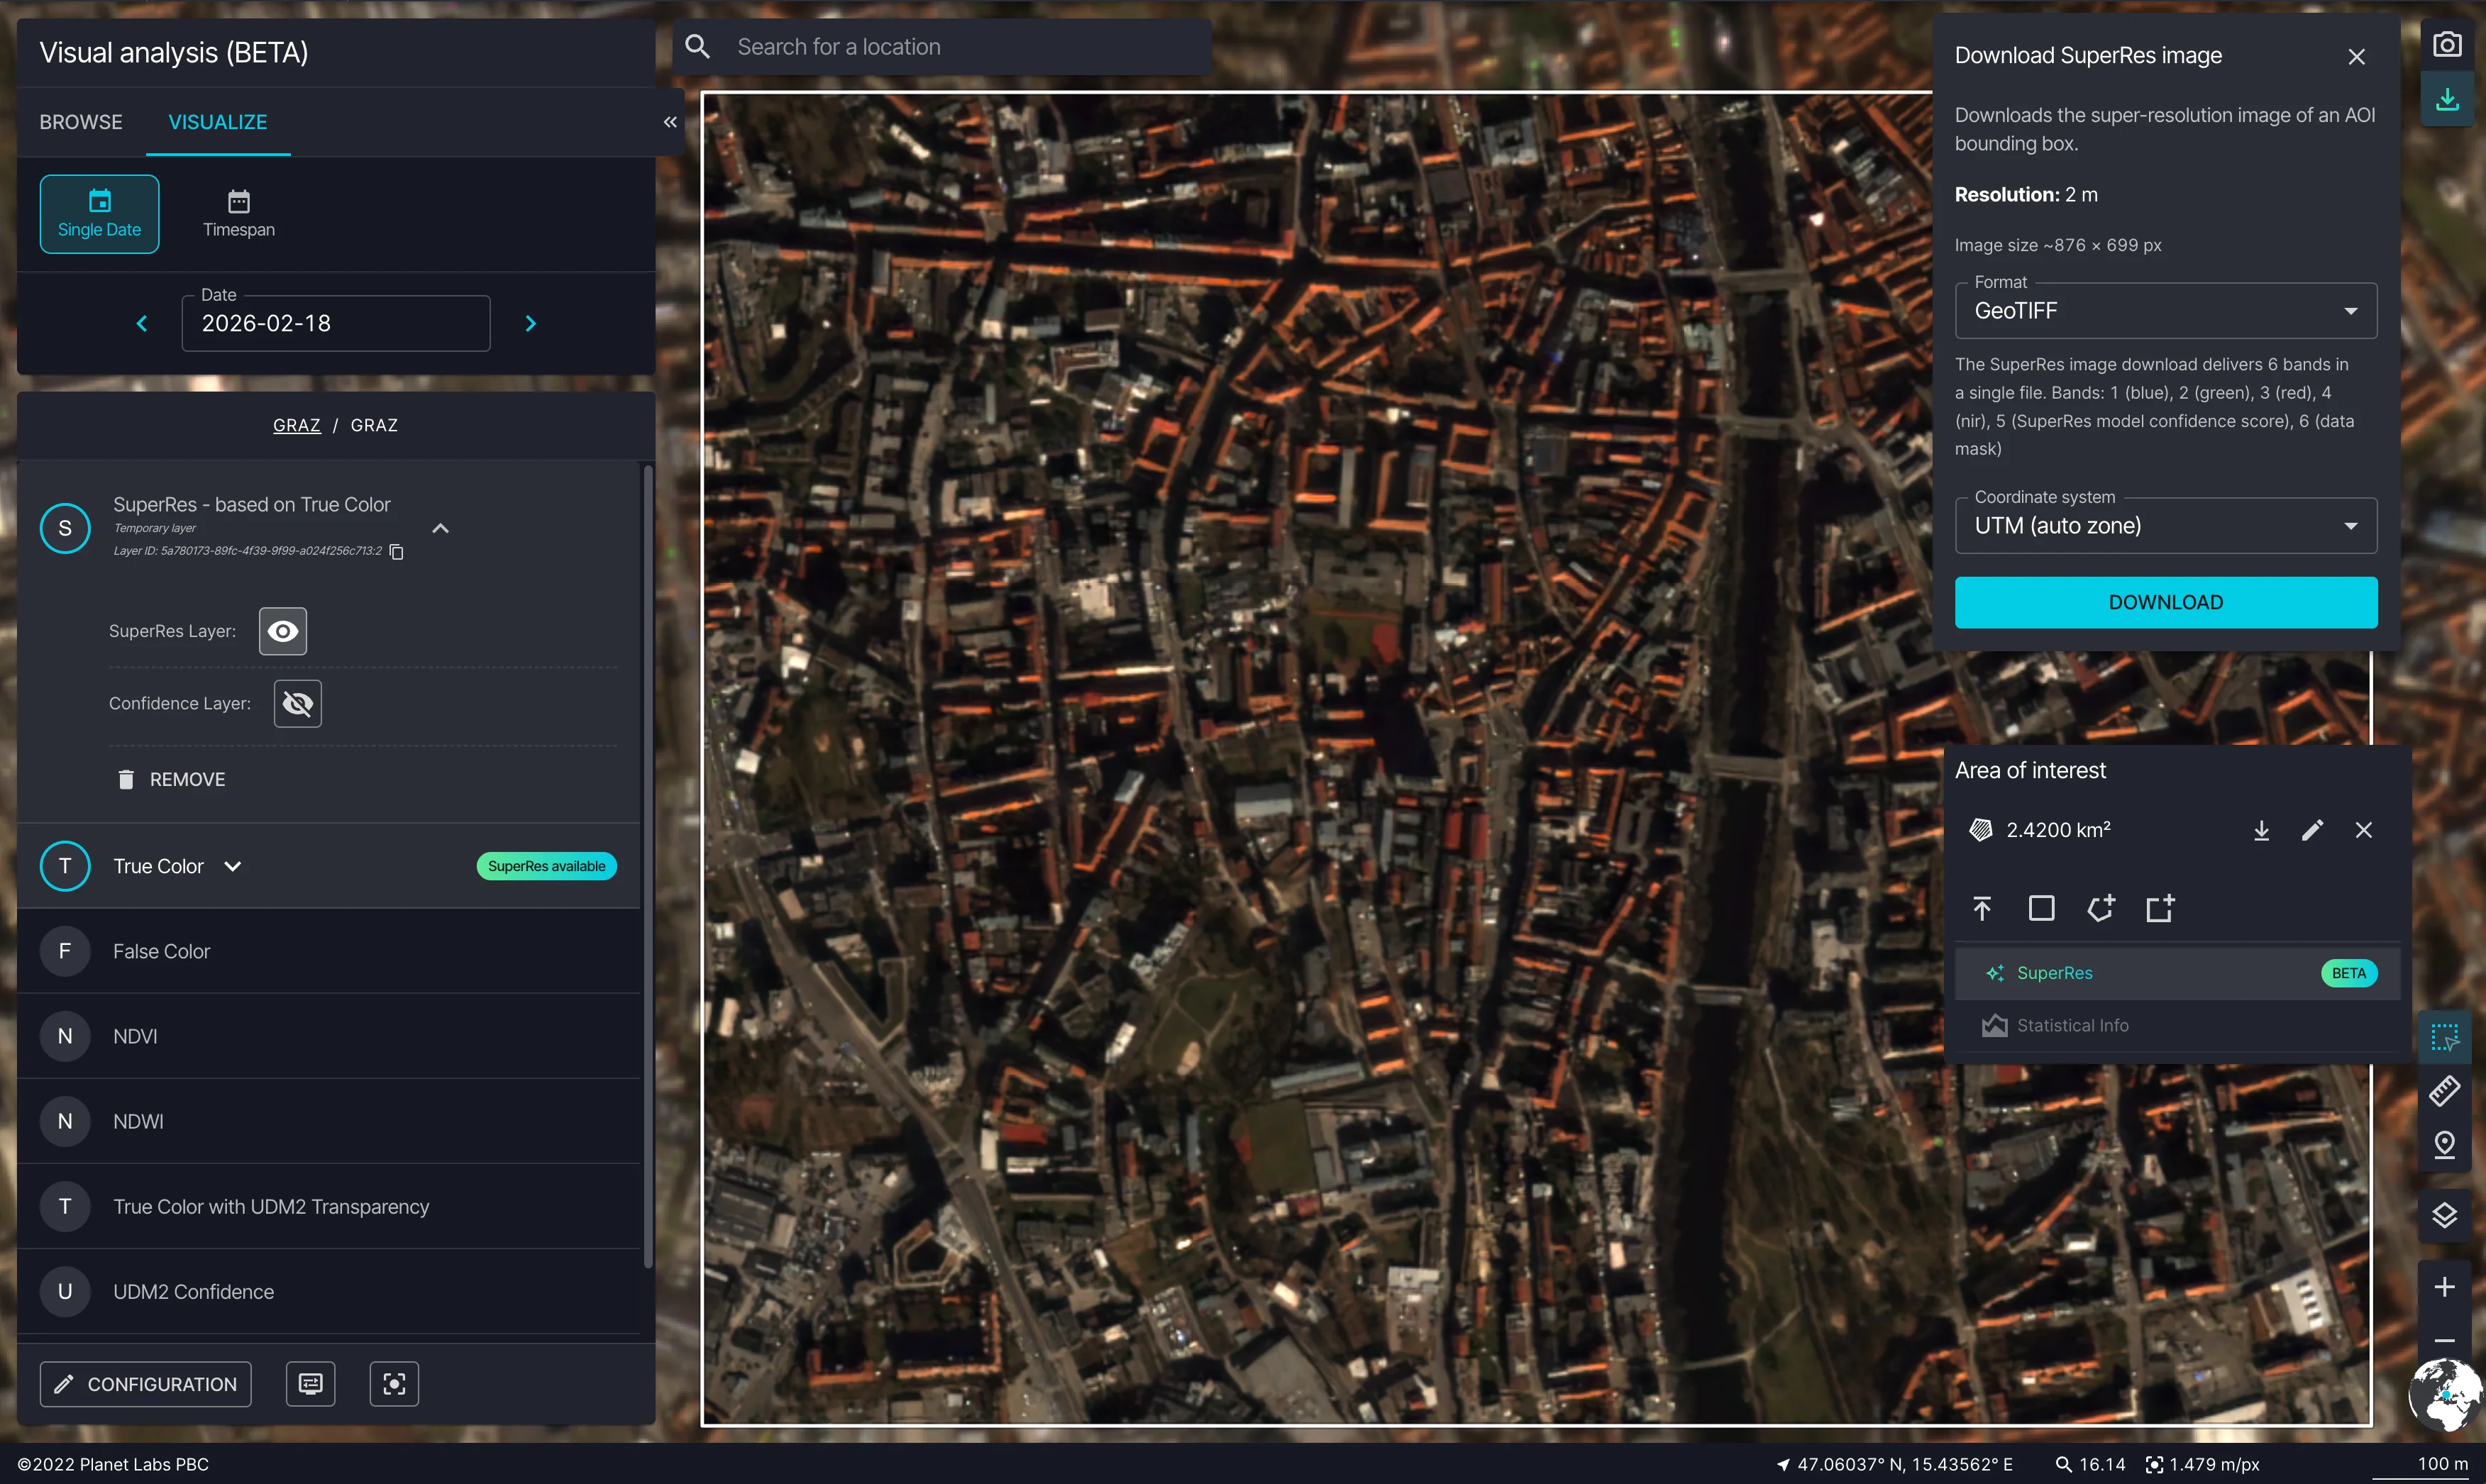
Download SuperRes image
Additional Map Tools
The map toolbar provides several tools for deeper analysis:
- Measure a distance / Measure an area — draw on the map to measure linear distances or polygon areas in your preferred units.
- Map Base Layer (bottom right above the + icon) — switch between different background map styles (Satellite, Dark, Light). Labels and borders can also be toggled from this menu.
- Map Labels — toggle place-name labels on or off to reduce visual clutter.
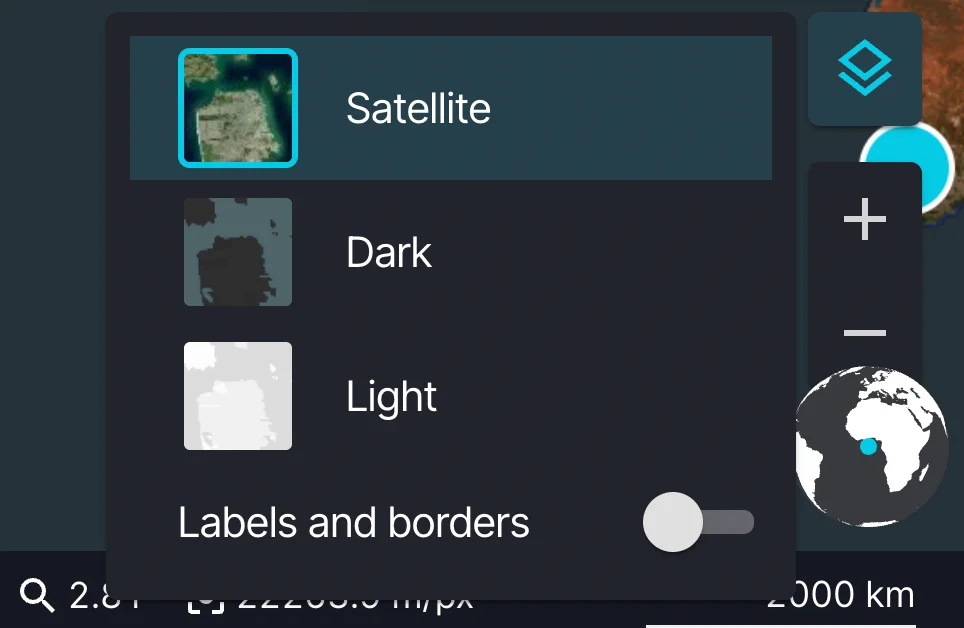
Map base layer options menu