Technical Specification
SURFACE REFLECTANCE
v1.1.0, April 2026
1. Analysis-Ready Planetscope Overview
The PlanetScope (PS) constellation of hundreds of CubeSats in low Earth orbits represents a novel observational resource, which when combined with advances in conventional spaceborne sensing has resulted in a proliferation of satellite sensor data with unprecedented spatial, temporal, and spectral resolution. This constitutes a revolution in the ability to derive time-critical, location-specific insights about dynamic land surface processes. However, the potential for these systems to support decision making is often limited by sensor interoperability issues (Figure 1), cross-calibration challenges, and atmospheric contamination. These obstacles can stand in the way of realizing the full potential of these rich datasets.
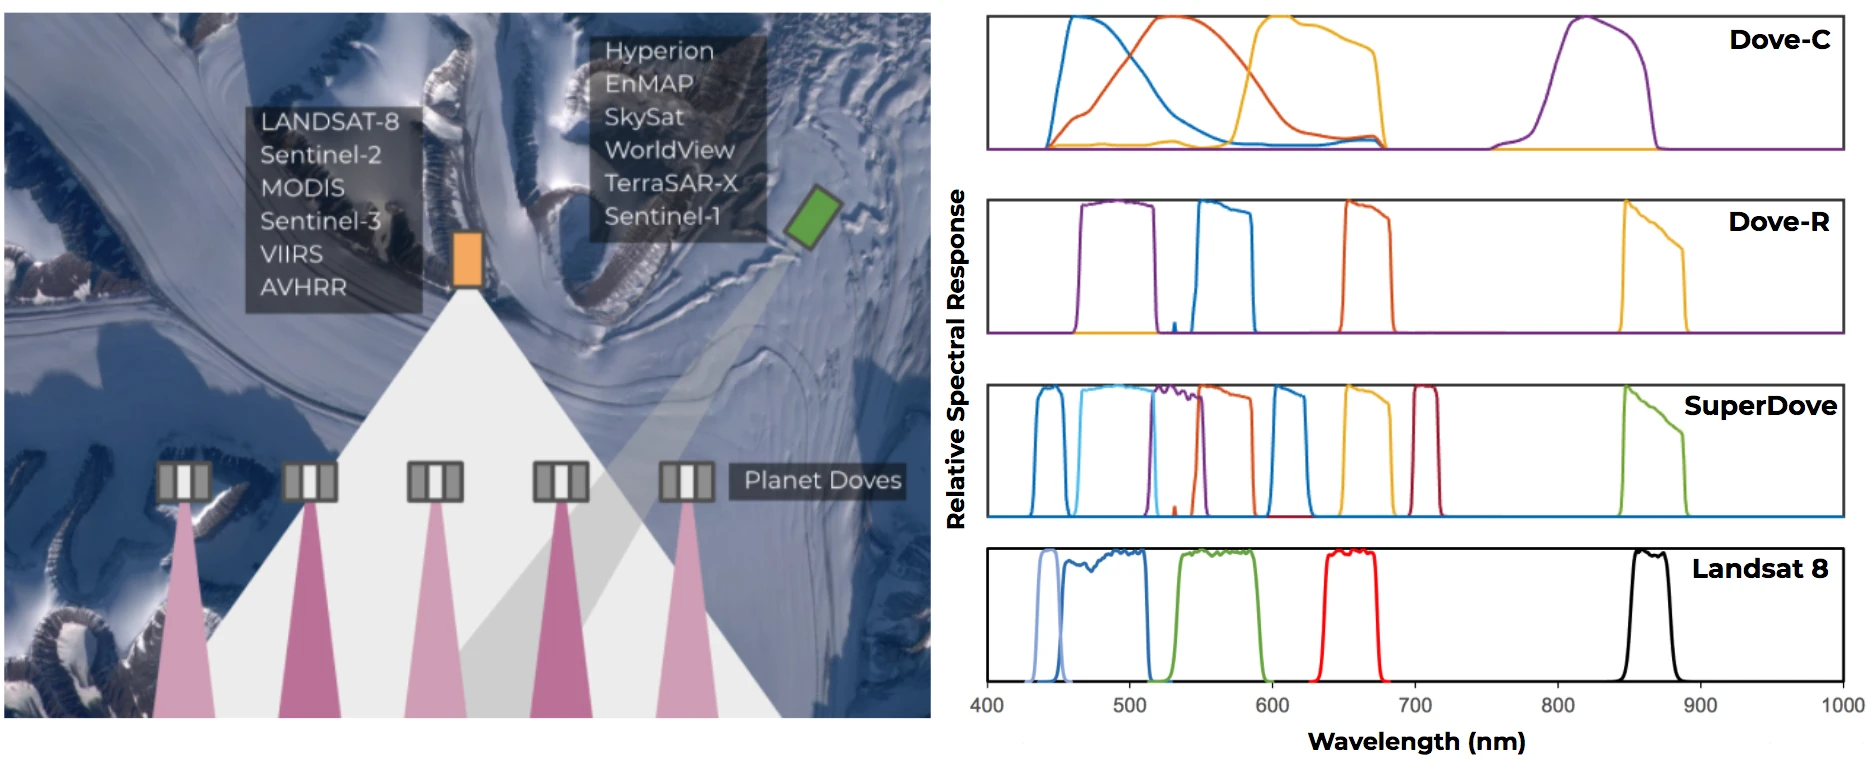
Figure 1: Sources of interoperability issues. Left: The reflectance field of the same observation target can appear very different at the point of the satellite sensor due to differences in satellite viewing and sun illumination angles augmented by shadow effects and non-lambertian surface characteristics (for example, as described by the Bidirectional Reflectance Distribution Function; BRDF). Right: Differences in spectral bands and spectral response functions can result in poor sensor interoperability. This is particularly pronounced when comparing Dove-C (for example, first generation PlanetScope) with public sensor sources (such as L8).
At Planet, a rigorous methodology has been implemented and improved to enhance, harmonize, inter-calibrate, and fuse cross-sensor data streams. The CubeSat-Enabled Spatio-Temporal Enhancement Method (CESTEM) (Houborg and McCabe 2018a, 2018b) leverages rigorously calibrated publicly accessible multispectral satellites (for example, Sentinel, Landsat, MODIS, VIIRS) to work in concert with the higher spatial and temporal resolution data provided by Planet's Dove CubeSats. The result is a next generation, analysis ready, harmonized Level-3 data product, which delivers a clean (for example, clouds and cloud shadows clearly labeled), temporally consistent, and radiometrically accurate 4-band surface reflectance (SR) data product.
Analysis-Ready PlanetScope (ARPS) combines distributed observations from the hundreds of individual sensors that make up the PlanetScope constellation (using three generations of hardware). These observations are radiometrically and geometrically harmonized with each other while ensuring radiometric consistency with a suite of widely used reference satellite platforms. The result is a highly temporally consistent stack of PlanetScope data. This next generation Analysis Ready Data (ARD) product is suitable for analytic and data science purposes. Analysis-Ready PlanetScope involves significant processing and novel methodology in the attempt to create a unique surface reflectance product enhanced in resolution, quality, and interoperability (Figure 2), as the pathway to usability and meaningful remote sensing driven insights.
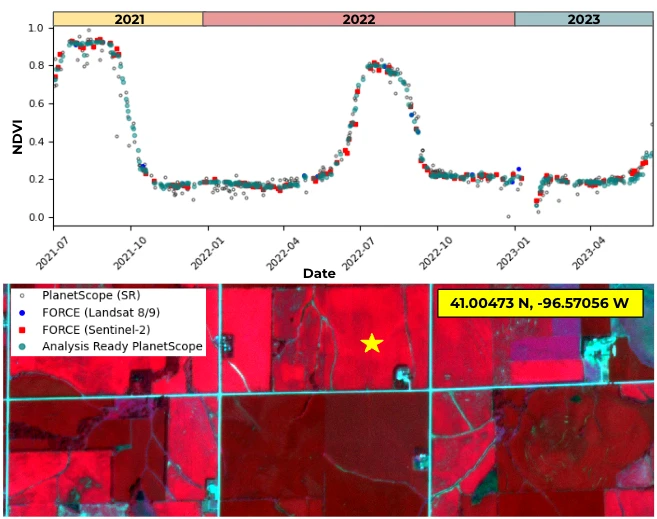
Figure 2: Normalized Difference Vegetation Index (NDVI) time series over a crop field near Lincoln (NE) over the course of two years (July 2021 – July 2023). The ARPS processing translates original PlanetScope Top Of Atmosphere (TOA) reflectance inputs into Surface Reflectances (SR) consistent with Landsat 8/9 and Sentinel-2 clear-sky observations. Note the increased harmonization amongst ARPS observations and FORCE as compared to PlanetScope SR.
The unique features of Analysis-Ready PlanetScope can be summarized as:
-
Advanced radiometric harmonization which leverages rigorously calibrated third-party sensors (MODIS/VIIRS, Landsat 8/9, and Sentinel-2) for full fleet interoperability
-
Rigorous, temporally driven, cloud and cloud shadow detection
-
Cleaned (for example, with cloud mask included) Surface Reflectance values delivered with a 48 hour latency
-
CubeSats with near-nadir field of view result in minimal BRDF variation effects
-
Designed to provide high radiometric accuracy and spatio-temporal consistency
-
Geometric harmonization with sub-pixel co-registration/alignment of stacked imagery
-
Topographic correction to remove the effect of terrain and illumination conditions on the surface reflectance signal
-
Includes pixel traceability information to easily identify source imagery for every data point
2. Analysis-Ready Planetscope Inputs
Table 1 lists the data sources currently used in Analysis-Ready PlanetScope (ARPS) production.
Planet's collection of hundreds of CubeSats operates in Sun synchronous orbits (altitude ~475 km) with a midmorning equatorial overpass time (9:30–11:30 a.m., local solar time) providing global near-nadir (~4° field of view) imaging on a near-daily basis (Roy et al., 2021). Three generations of "Doves" (collectively referred to as "PlanetScope" in this document) are used as input to ARPS products: the Dove-Classic constellation (2016–2022) is characterized by broad and partly overlapping spectral bands in the visible and near-infrared (NIR) spectrum (Figure 1), whereas the Dove-R (2019–2022) and SuperDove (2020–) constellations are improved to be directly interoperable with the visible and narrow NIR bands of Sentinel-2. The nominal ortho scene size (at 475 km altitude) is also larger for Dove-R (~25 km x 23 km) and SuperDove (~32.5 km x 19.6 km) relative to Dove-Classic (~25 km x 11.5 km). PlanetScope Top Of Atmosphere (TOA) Radiance inputs contribute the bulk of the observations used to make ARPS, and they are derived from 4-band Orthorectified Scene Products that have a resampled pixel size of 3 m (the ground sampling distance depends on the altitude and generation of each satellite and ranges from 3.7 to 4.2 m). While the SuperDove is an 8-band sensor (for example, it adds bands in the visible and red-edge domain compared to previous generations of Doves), currently only the blue, green, red, and NIR bands are used in ARPS production.
Table 1: List of inputs currently used in Analysis-Ready PlanetScope production.
| Product | Description |
|---|---|
| PS-TOA | Scene-based PlanetScope Top Of Atmosphere (TOA) Radiance (4-band, resampled to 3 m pixels) (https://assets.planet.com/docs/Planet_PSScene_Imagery_Product_Spec_letter_screen.pdf) |
| MCD43A4, MCD43A4N | Tile-based MODIS Surface Reflectance (SR) normalized to a nadir view direction and local solar noon (daily, 500 m) (https://lpdaac.usgs.gov/products/mcd43a4v061/) |
| VNP43IA4, VNP43IA4N | Tile-based SR (VIIRS imagery bands) normalized to a nadir view direction and local solar noon (daily, 500 m) (https://lpdaac.usgs.gov/products/vnp43ia4v001/) |
| VNP43MA4, VNP43MA4N | Tile-based SR (VIIRS moderate bands) normalized to a nadir view direction and local solar noon (daily, 1000 m) (https://lpdaac.usgs.gov/products/vnp43ma4v001/) |
| FLS-SR | In-house implementation for tile-based generation of Nadir BRDF Adjusted Reflectances (NBAR) from Landsat 8/9 and Sentinel-2 data (4-band, 30 m). The Landsat 8/9 data have been spectrally adjusted to match Sentinel-2 spectral band passes. Based on the Framework for Operational Radiometric Correction for Environmental Monitoring (FORCE) (https://github.com/davidfrantz/force) |
A scalable implementation of the Framework for Operational Radiometric Correction for Environmental Monitoring (FORCE version 3.7.10; Frantz 2019a) is used for generating a combined Landsat 8/9 (L8/9) and Sentinel-2 (S-2) surface reflectance product (FLS-SR) to be used as the "gold reference" during the radiometric calibration and normalization of ARPS products. FORCE includes state-of-the-art atmospheric correction, topography/terrain correction, cloud and cloud shadow detection, spatial co-registration, and view angle normalization (Frantz 2019a). FORCE infers surface reflectance from L8/9 and S-2 imagery using an implementation of the 5S (Simulation of the Satellite Signal in the Solar Spectrum) code (Tanre et al., 1990). The aerosol optical depth is estimated from the imagery using a dark object based approach whereas the water vapor content is either estimated on a pixel-specific basis (S-2) or derived from a global MODIS-based database (L8/9) (Frantz et al., 2019b). Clouds and cloud shadows are detected using a modified version of Fmask (Zhu and Woodcock, 2012) that exploits parallax effects to improve detections for S-2 images (Frantz et al., 2018). However the FORCE derived cloud masks may be further refined as part of ARPS processing (Section 4.3). A global assessment of the FORCE atmospheric correction approach has been conducted as part of the Atmospheric Correction Inter-comparison Exercises (ACIX, ACIX-II) (Doxani et al., 2018 & 2023).
The FORCE implementation maps the L8/9 and S-2 data onto a common grid (for example, the UTM-based Military Grid Reference System) to produce 30 m resolution L8/9 and S-2 data with a 2–3 day frequency. A spectral bandpass adjustment (Claverie et al. 2018) is applied to L8/9 to align with S-2 radiometry. Only the blue (center wl: 0.490 µm, bandwidth: 0.065 µm), green (center wl: 0.560 µm, bandwidth: 0.035 µm), red (center wl: 0.665 µm, bandwidth: 0.030 µm), and narrow NIR (center wl: 0.865 µm, bandwidth: 0.021 µm) bands (S-2 radiometry) are currently used for ARPS production. The reported bandwidths are the values measured at Full Width Half Maximum (FWHM).
MODIS or VIIRS surface reflectance (SR) data normalized to nadir view and local solar noon is a required input to the ARPS reference sampling and calibration process (Section 4.4). ARPS uses the version 6.1 combined (for example, Terra and Aqua) MCD43A4 product that provides daily 500 m SR in 7 bands corrected for reflectance anisotropy (MODIS has a ~110° field of view) using a semiempirical bidirectional reflectance distribution function (BRDF) (Schaaf et al. 2002). The BRDF utilizes the best observations from both Terra and Aqua sensors collected over a 16-day period centered on the day of interest where observations at the day of interest are emphasized in the daily retrieval. Only the blue (0.459–0.479 µm), green (0.545–0.565 µm), red (0.62–0.67 µm), and NIR (0.841–0.876 µm) bands are ingested for ARPS processing. The near real-time product version (MCD43A4N) is used when the standard product is not available (for example, as dictated by a 9 days latency). The VIIRS products (VNP43IA4/VNP43IA4N, VNP43MA4/VNP43MA4N) have been designed to ensure continuity of MCD43 and are used as a backup should MCD43A4/MCD43A4N become unavailable. The VIIRS-based processing ingests the red (0.60–0.68 µm) and NIR (0.85–0.88 µm) Imagery bands (500 m) in addition to the blue (0.478–0.488 µm) and green (0.545–0.565 µm) Moderate bands (1000 m). Since the two latter bands are provided at a coarser spatial resolution (1000 m), the finer resolution (500 m) red band is used to super-resolve the 1000 m band data for consistency.
3. Analysis-Ready Planetscope Products
The Analysis-Ready PlanetScope product line (ARPS) is outlined in Table 2. The ARPS products are provided at a near-daily cadence and orthorectified onto a fixed grid (see Section 3.4) with a 3 m pixel size. The products can be produced starting from January 1, 2017 and up till present, deliverable with a 48 hour latency (For example, data requested for Monday will typically be delivered Wednesday).
Table 2: Overview descriptions of the Analysis-Ready PlanetScope (ARPS) products.
| Product key | Description |
|---|---|
| ARPS-SR | ARPS Surface Reflectance (SR) product. PS TOA Reflectance radiometrically harmonized to 4-band FLS-SR using the CESTEM methodology. |
| ARPS-QA | ARPS Quality Assurance (QA) product |
| ARPS-STAC | ARPS SpatioTemporal Asset Catalog (STAC) items and catalog |
3.1. Surface Reflectance Product (ARPS-SR)
The Analysis-Ready PlanetScope Surface Reflectance product (ARPS-SR) records gridded (3 m), radiometrically and geometrically corrected orthorectified PlanetScope data in four spectral bands (blue, green, red, NIR) at a near-daily interval. The data is stored in 16-bit integer format (with a multiplication factor of 10,000) as cloud optimized geotiffs compressed using LZW compression. During ARPS processing and harmonization, 4-band PS TOA Reflectance (PS-TOAR) (converted from the radiances) are transformed into surface reflectances ensuring radiometric consistency with Sentinel-2. As a result the spectral bands and spectral response functions of ARPS data (Table 3) will be equivalent to the blue (B2), green (B3), red (B4), and narrow NIR (B8a) bands of Sentinel-2 (ESA 2024).
The ARPS-SR data represents Normalized BRDF Adjusted Reflectances (NBAR) as the Landsat 8/9 and Sentinel-2 data used for cross-calibration have been normalized to nadir view (Roy et al. 2016, 2017). As the ARPS cross-calibration adopts a multi-temporal reference sampling approach (see Section 4.4), the significant uncertainties related to the L8/L9/S-2-based BRDF normalization (Roy et al. 2017) are likely to cancel out. In addition, in contrast to L8/9 (~15° field of view) and particularly S-2 (~21° field of view), the PlanetScope sensors are nadir viewing natively (~4° field of view), which will act to further reduce view angle BRDF effects.
Table 3: ARPS-SR data format specifications providing the band-specific center wavelengths and bandwidths (bw). The bandwidths are the values measured at FWHM.
| Layer | Description | Date Type | Valid range | Scale factor |
|---|---|---|---|---|
| Band 1 | Blue band (0.490 µm, bw: 0.065 µm) SR (NBAR) | 16-bit signed integer | 1 - 10,000 | 0.0001 |
| Band 2 | Green band (0.560 µm, bw: 0.035 µm) SR (NBAR) | 16-bit signed integer | 1 - 10,000 | 0.0001 |
| Band 3 | Red band (0.665 µm, bw: 0.030 µm) SR (NBAR) | 16-bit signed integer | 1 - 10,000 | 0.0001 |
| Band 4 | NIR band (0.865 µm, bw: 0.021 µm) SR (NBAR) | 16-bit signed integer | 1 - 10,000 | 0.0001 |
3.2. Quality Assurance Product (ARPS-QA)
The Analysis-Ready PlanetScope Quality Assurance product (ARPS-QA) is a 2 layer thematic raster using the same spatial grid as the corresponding ARPS-SR product. It contains information denoting cloud and cloud shadow detection (layer 1) and pixel traceability/provenance (layer 2) (Table 4).
Table 4: ARPS-QA data format specifications. Note that additional metadata have been embedded in the tiff file, as described in the table and listed separately in Table 5
| Layer | Description | Date Type | Valid range | Scale factor | Offset |
|---|---|---|---|---|---|
| Layer 1 | Cloud and cloud shadow mask 1 = Clear 2 = Bright Clouds 3 = Cloud shadows 4 = Haze 5 = Adjacent clouds/clouds shadows 6 = Additional cloud/shadow/haze elements based on a cross-scene correlation detection approach 7 = Suspect (for example, poor image quality, radiometric or geometric quality issues) -999 = Scene data not available | 16-bit signed integer | 1 - 7, and -999 | 1 | 0 |
| Layer 2 | Pixel traceability/provenance mask (see embedded metadata for scene IDs) -999 = Scene data not available | 16-bit signed integer | 1 - 200, and -999 | 1 | 0 |
Figure 3 depicts the cloud and cloud shadow mask from QA layer 1.
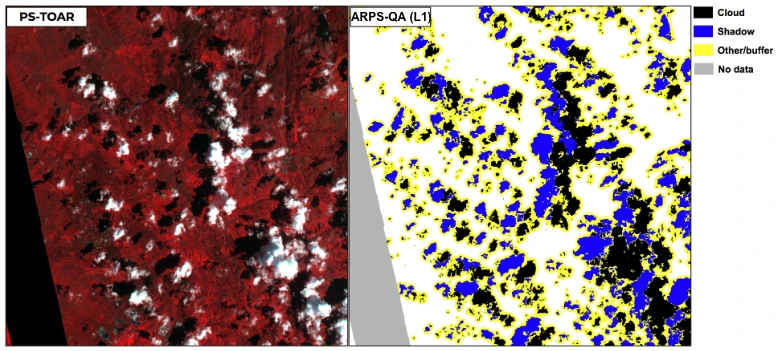
Figure 3: QA layer 1 (cloud and cloud shadow mask) and input PS-TOAR product.
A pixel traceability/provenance mask is also provided in QA layer 2 (Figure 4). This raster layer identifies the footprints of the PlanetScope scenes used to produce any given tile image (cloudy or clear). Each domain is associated with a unique integer value that is linked to a scene identifier (for example, Itemtype/sceneID) embedded as metadata in the QA geotiff. The scene identifier (For example, PSScene/20190701*172222_104e) provides the information needed to locate and access the source data through Planet's API. The embedded metadata may be displayed using GDAL (For example, gdalinfo name_of_file.tif). Note that the scene identifier is formatted as <acquisition_date>*<acquisition*time>*<acquisition time seconds hundredths>\_<satellite_id>. This provides information on the time of acquisition for each pixel in the image. Importantly, and as further detailed in Section 4.6, more than one PlanetScope scene may be contributing to the same date-specific image domain. If that is the case, the tiff embedded metadata will list two or more scene identifier links to the unique integer value (footprint).
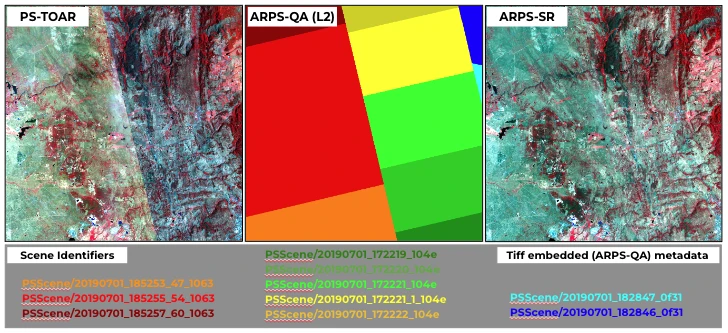
Figure 4: QA layer 2 (pixel traceability mask) for the tile in Figure 3 (8000 x 8000 pixels) on July 1, 2019. In this case, a total of 10 PS ortho scenes from three separate strips were used to construct the tile image. The associated scene identifiers were extracted from the ARPS-QA embedded metadata. The visible seam lines in the PS-TOAR product result from merging Dove-R (reddish strip) and Dove-C (greenish strip) scene data with quite different spectral bands and Relative Spectral Response (RSR). Note that these transitions are not visible in the final ARPS-SR output.
The QA product includes several pieces of non-raster metadata embedded in the tiff header. These are described in Table 5.
Table 5: List of metadata embedded in the header of ARPS-QA tiff files
| Name | Description | Example |
|---|---|---|
| CREATED | Timestamp of the product creation, corresponding to the time at which contributing satellite observations were gathered. | 2024-09-20T17:19:27Z |
| PERCENTAGE_CLEAR | Fraction of pixels in the raster marked as class 1, "clear", in the QA layer 1 cloud mask | 86.68 |
| PERCENTAGE_STANDARD_QUALITY | Fraction of observed pixels in the tile which came from "standard" (as opposed to "test" quality PlanetScope images, see Roy et al., 2021) | 100 |
| PIPELINE_VERSION | Version identifier for the image processing pipeline used to create that day's data | 1.0.0 |
| RUN_TYPE | Designates whether the data were produced in "backfill" or "forwardfill" mode. (See Section 4.7) | backfill |
| SCENE_IDS[LAYER_2_VALUE] | Newline-separated scene IDs corresponding to integer reference numbers in QA layer 2. See the layer 2 description above for more information. | PSScene/20210708_131909_101b[1] PSScene/20210708_131910_101b[2] PSScene/20210708_131911_101b[3] PSScene/20210708_131912_101b[4] PSScene/20210708_134254_06_2406[5] None[-999] |
| PERCENTAGE_BAD_GEOMETRY | The percentage of pixels identified with bad geometry for each scene contributing to the footprint (as identified in the layer 2 scene provenance raster) | 0[1] 0[2] 0[3] 0[4] 0[5] None[-999] |
| PERCENTAGE_BAD_RADIOMETRY | The percentage of pixels identified with bad radiometry for each scene contributing to the footprint (as identified in the layer 2 scene provenance raster) | 0[1] 0[2] 0[3] 0[4] 0[5] None[-999] |
| SCENE_SOLAR_AZIMUTH[LAYER_2_VALUE] | The solar azimuth in degrees for each scene contributing to the footprint (as identified in the layer 2 scene provenance raster) | 40.30[1] 40.20[2] 40.20[3] 40.20[4] 35.00[5] None[-999] |
| SCENE_SOLAR_ELEVATION[LAYER_2_VALUE] | The solar elevation in degrees for each scene contributing to the footprint (as identified in the layer 2 scene provenance raster) | 38.60[1] 38.50[2] 38.50[3] 38.40[4] 41.90[5] None[-999] |
3.3. Spatiotemporal Asset Catalog (ARPS-STAC)
All Analysis-Ready PlanetScope products are delivered with a SpatioTemporal Asset Catalog (STAC) file that conforms to the STAC specifications. This STAC item contains information that summarizes the properties of the ARPS-SR and ARPS-QA products. This includes the version of ARPS that the products were generated with, the dates that the products were created, and support for several STAC extensions.
| STAC Extension | Description |
|---|---|
| Projection | Coordinates representing the bounding geometry of the raster's footprint |
| Raster | Properties of the tile pixels |
In addition, the "properties" section of each STAC item contains a copy of the metadata included in the header of the QA raster (described in Table 5). Metadata entries which contain lists of items (For example, "SCENE_IDS[LAYER_2_VALUE]") are contained in the STAC item as lists of items, not single strings. Metadata keys are given in lower case (For example, "SCENE_IDS[LAYER_2_VALUE]" from the tiff header is "scene_ids[layer_2_value]" in the STAC item's "properties" block).
3.4. Delivery, Projection, and Gridding
Analysis-Ready PlanetScope products are delivered through the Planet Subscriptions API, clipped to a provided Area of Interest (AOI). Each Subscription will receive 3 files (ARPS-SR, ARPS-QA, and ARPS-STAC) for each day in which at least some PlanetScope imagery intersects the requested AOI. If no PlanetScope surface reflectance data are available for a given day over the requested AOI, no files will be provided for that day. The AOI-clipped data have a 3 m pixel size and are projected in the UTM zone intersected by their extent using the WGS-84 horizontal datum.
If a requested AOI is too large to deliver as a single file, it will instead be delivered as a series of regularly gridded raster tiles. Tiles have a 3 m pixel size, a 24 by 24 km extent (8000 pixel width and height), and are projected in the UTM zone intersected by their extent using the WGS-84 horizontal datum. Tile identifiers are based on a "{i}E-{j}N" template, where "i" is the zero-based easting index and "j" is the zero-based northing index using the origin of the UTM zone's coordinate reference system. For tiled delivery, each subscription will receive one ARPS-SR, one ARPS-QA, and one ARPS-STAC file per tile per day.
Regardless of the size of the requested AOI, all ARPS processing described in this document takes place using regularly gridded raster tiles. The tile size for each Subscription is selected from a pre-defined set of grids based on the size and placement of the requested AOI.
4. Analysis-Ready Planetscope Methodology
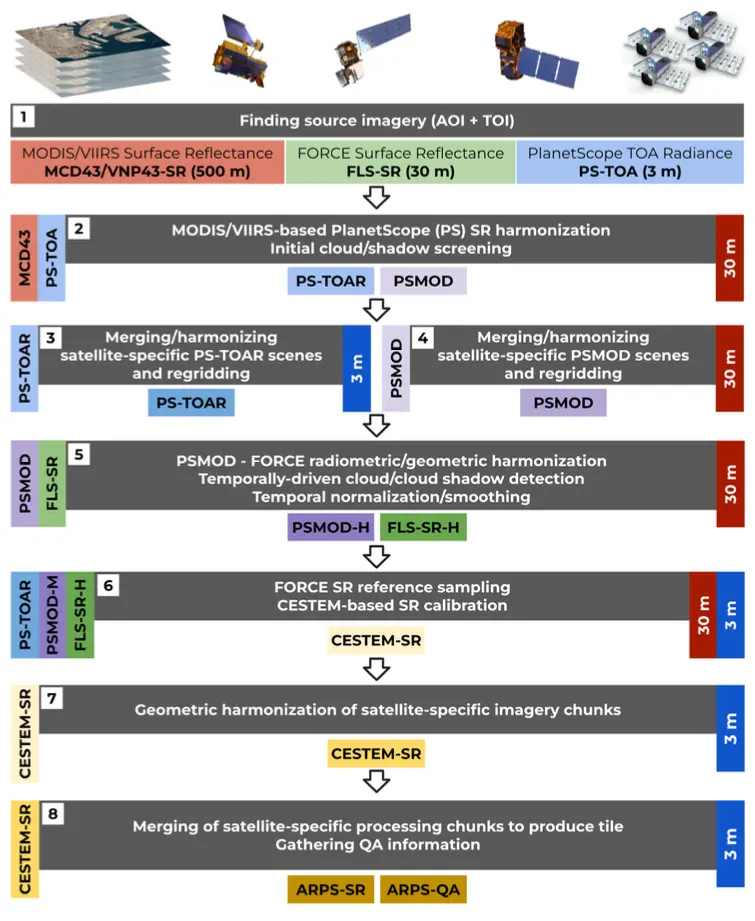
Figure 5: A generalized overview of Analysis-Ready PlanetScope processing modules for any given ARPS tile and TOI. The diagram highlights the key intermediate and final product artifacts, the associated pixel resolution (3 or 30 m) and processing features (For example, cloud masking, radiometric and geometric harmonization, time-series processing).
The overall methodological elements of Analysis-Ready PlanetScope surface reflectance processing are diagrammed in Figure 5. ARPS products are based on an implementation of the CubeSat-Enabled Spatio-Temporal Enhancement Method (CESTEM), which has been described in detail in Houborg and McCabe 2018a/2018b. ARPS processing includes significant refinements and additional functionality related to geometric harmonization, topographic correction, and cloud masking. Key elements of the approach and processing specifics are outlined below.
While ARPS data are delivered as clipped AOIs, they are processed in units of tiles (as described in Section 3.4).
4.1. Tile-Level Stacking
After identifying the source imagery (PS-TOA, FLS-SR, PSMOD) that intersect with a given ARPS tile over a specified Time Of Interest (TOI) (step 1, Figure 5), the respective input streams are stacked and re-gridded to the ARPS tiling system (Section 3.4) with either a 3 m or 30 m pixel resolution (step 2/3/4, Figure 5).
In the case of the scene-based PlanetScope TOA reflectance (PS-TOAR) data, several scenes from multiple satellites may be overlapping with parts of the tile domain on any given day (Figure 4). Each satellite will in general take multiple sequential scenes, collectively designated a "strip". Satellite-specific scenes (for example, scenes from a given satellite strip) will be processed, merged, and clipped to the tile domain independently. The merging of the satellite-specific tiles will happen once all radiometric and geometric processing is complete (step 8, Figure 5) as further detailed in Section 4.6.
A phase correlation technique (Section 4.5) is used to help ensure that the PlanetScope scenes from a given satellite-specific strip are geometrically aligned/co-registered (with sub-pixel precision) before compositing the strip. In addition, the re-aligned PS-TOAR scenes are brightness harmonized across the strip domain to facilitate a seamless surface reflectance calibration (Section 4.4). The brightness harmonization utilizes the clear-sky overlap between scenes within the satellite-specific strip to derive band-specific regression coefficients that are used to normalize the reflectance magnitudes across the scenes.
A 30 m resolution stack of MODIS/VIIRS Surface Reflectance-calibrated PlanetScope imagery (PSMOD) is also produced (step 2/4, Figure 5). The MODIS/VIIRS calibration is performed at the PlanetScope scene level using day-coincident MCD43/VNP43 NBAR products (Table 1) as the radiometric reference, translating PS-TOAR into MODIS/VIIRS-consistent SR data (Houborg and McCabe 2018a, 2018b) (step 2, Figure 5). The scenes from a given satellite-specific strip are processed as described above for PS-TOAR when producing the tile. This also involves co-registration of the 30 m PSMOD scenes prior to merging and tile composition.
The FORCE-based Surface Reflectance tiles (FLS-SR) are mapped onto the ARPS tiling grid in a similar way.
4.2. Topographic Correction
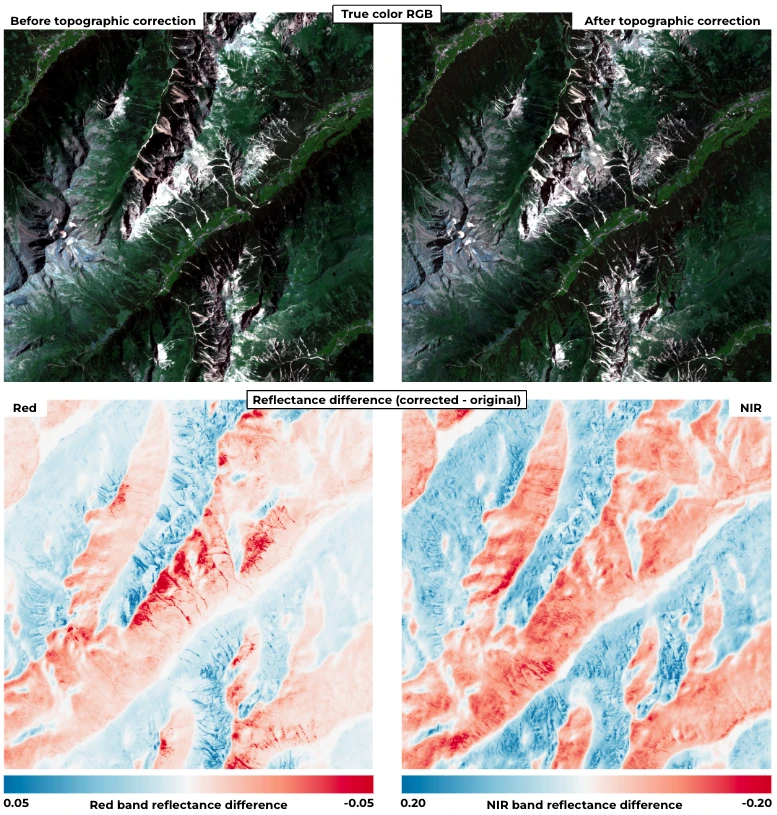
Figure 6: Visualization of the impact of the topographic correction on PlanetScope imagery acquired over a mountainous region in Austria on 2022-07-19. The impacts are significant over the sloping terrain with reflectance corrections ranging from approximately ±0.05 (red) and ±0.20 (NIR) reflectance units.
Topography (irregular shape of the terrain) will affect the surface reflectance as a function of sun illumination conditions (sun elevation and sun azimuth), terrain shape (slope and aspect), and surface and atmospheric characteristics. Topography can significantly alter the reflectance signal and obfuscate the interpretation of surface characteristics in space and time. Topographic corrections attempt to remove the effect of topography on reflectance so that identical surface phenomena (such as vegetation type) produce comparable reflectance signals irrespective of terrain characteristics.
A topographic correction is applied to the PlanetScope-based product artifacts (Figure 6) produced by the ARPS pipeline. The FORCE surface reflectance data have also been corrected for the effects of topography on reflectance (Frantz 2019a). The topographic correction adopted by ARPS shares similarities with the approach adopted in FORCE and is based on modeling illumination conditions using a Digital Elevation Model (GLO-30, https://doi.org/10.5270/ESA-c5d3d65) to compute slope and aspect information (using the GDAL "gdaldem" functionality) along with sun elevation and sun azimuth information from the PS scenes. For simplicity, Lambertian (for example, no directional dependence on reflected light) surface conditions are assumed. The implementation is based on the Sun-Canopy-Sensor with C-correction approach described in Soenen et al. 2005. The semi-empirical C-correction component is included to avoid over-corrections by accounting for the effects of diffuse radiation (Teillet et al. 1982). Band-specific C values are initially derived for each date and satellite-specific tile domain (for example, for slopes greater than 10 degrees) from a linear regression between pixel-wise illumination condition (a function of slope, aspect, sun elevation, and sun azimuth) and the reflectance signal. The derived C values can be associated with significant uncertainty and will strongly depend on the reflectance type (SR versus TOAR) and atmospheric condition (such as cloud contamination, haze, and degree of diffuse radiation). The derived C values (across the full TOI) are used to train SR and TOAR specific C models that will subsequently be used to predict more robust and consistent band-specific C values needed for a reliable topographic correction of the PS-based stacked product artifacts produced in steps 3 and 4 (Figure 5). A Cubist rule-based regression approach is used for predicting the band-specific C values as a function of illumination condition, sun elevation, sun azimuth, haze percentages, and aerosol optical depth (AOD). Daily AOD values are extracted from the Terra MODIS global Aerosol Optical Thickness product (MOD09CMA). This product has a spatial resolution of 5.5 km and the average of the best quality pixels within the tile domain is used. If no best quality pixels are found, the search is extended within an expanded domain centered on the tile and includes all valid values irrespective of quality. The C values are strongly dependent on scene haziness (for example, degree of diffuse radiation), and the inclusion of the AOD information helps create accurate band-specific models represented by Pearson's correlations typically in the range of 0.85 to 0.95.
The topographic correction is applied to PS pixels identified as either clear-sky or haze. The topographic correction is shown to significantly improve the agreement with day-coincident FORCE over AOIs with complex terrain and improves the overall quality of the ARPS data in regions with significant topography.
4.3. Cloud and Cloud Shadow Masking
Analysis-Ready PlanetScope cloud and cloud shadow detection (step 5, Figure 5) is performed at 30 m resolution using a temporally-driven approach that takes advantage of PlanetScope and FORCE (L8/9, S-2) surface reflectance information in a synergistic way. The approach starts from the original scene-based cloud and cloud shadow masks associated with both the PlanetScope and FORCE data. For PlanetScope, the initial cloud and cloud shadow mask is produced during the MODIS/VIIRS-based calibration stage (step 2, Figure 5) predominantly informed by UDM 2.0 (before 2023-11-23) or 2.1 (after 2023-11-23) detections, when available. A cloud verification approach is applied at this step in an attempt to reduce commission/omissions errors.
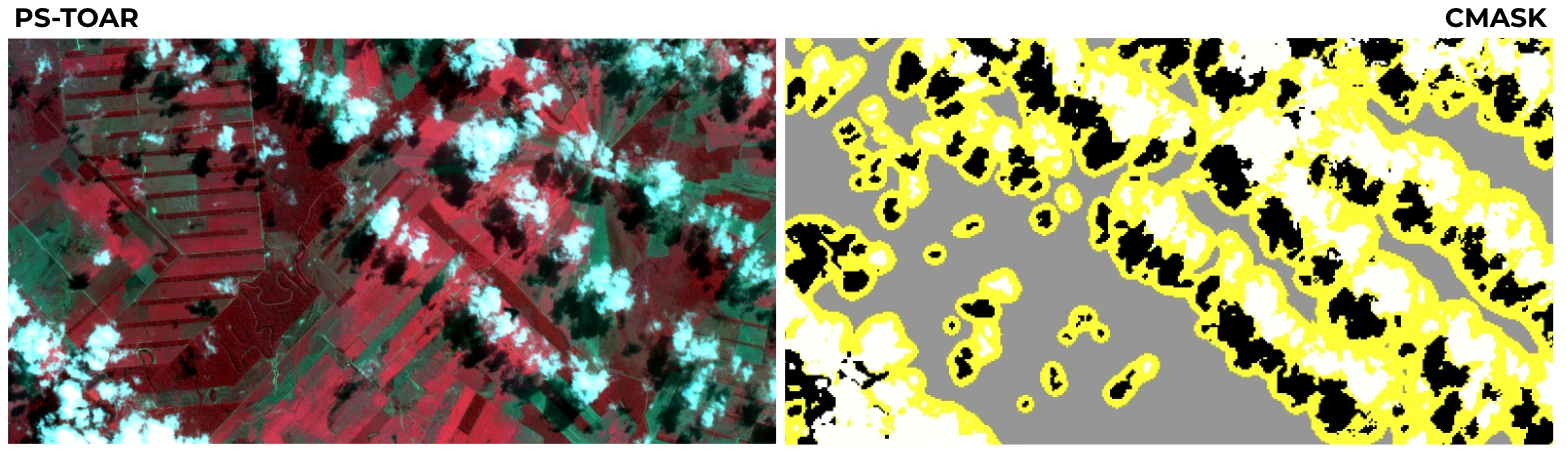
Figure 7: Example of ARPS cloud (white) and cloud shadow (black) detections over a region in Bolivia. Yellow represents the applied buffer around the detections.
The temporally-driven detection approach can accommodate PS and FORCE data acquired at different times on the same day. The multi-source input data are first geometrically harmonized (see Section 4.5) to improve detection results and reduce commission issues resulting from pixels not being properly aligned. The detection approach utilizes clear-sky observations (for example, as identified by the initial cloud masks) over a flexible temporal window (up to ±1 year) for any given 30 m pixel to help flag spectral outliers potentially resulting from cloud, cloud shadow, or haze contamination. The deep temporal stack of clear-sky observations is used to create a clear-sky background image for each acquisition date over the defined TOI. The clear-sky background image generation utilizes clear-sky information acquired from multiple dates in the past and future (if available) relative to the prediction date, and adopts daily class-specific spectral trajectories (derived on the basis of the clear-sky imagery stack) to change/adjust the past/future acquisition data to be more representative of surface conditions on the prediction date. After outlier screening, the temporally interpolated clear-sky observations are compared against the prediction date imagery to flag pixel domains (if any) exhibiting spectrally anomalous behavior (for example, dips or spikes). A carefully weighted average of the multi-temporal clear-sky inputs (this will include the prediction date data if not identified as anomalous) are then used to create the clear-sky background image. Next, the clear-sky background image is used in combination with the actual image acquired on the prediction date to identify spectrally distinct classes using an unsupervised k-means clustering approach. A suite of spectral difference metrics, such as the difference in red and NIR reflectance between the background and actual imagery, combined with a set of carefully defined spectral thresholds and a number of other constraints are then used to classify each cluster as clear, cloud, cloud shadow, or haze. The detection of haze can be particularly uncertain and MODIS-based AOD values (see Section 4.2) are integrated to help constrain and validate the UDM2-based haze detections to reduce false positives. Additional cross-correlation tests between the background and actual imagery serve to further resolve and label any cloud, cloud shadow, and haze contaminations. Furthermore, a series of automated techniques are implemented to verify these classifications and avoid (to the extent possible) masking out actual change. This includes the integration of hillshade information to help reduce commission issues in landscapes with significant terrain shadowing.
The cloud detected areas are expanded using a buffer zone (for example, adjacent cloud domain, layer 1 in Table 4) (see also Figure 7) to make it more likely that most of the contaminated pixels are identified in the final outputs. The scheme will refine and update the scene-based cloud masks (30 m) associated with both the PS (PSMOD-H) and FORCE (FLS-SR-H) data (step 5, Figure 5).
After the completion of the cloud masking step, a cloud verification step is invoked to further reduce commission errors. This step will only serve to unmask presumably false cloud/cloud shadow detections based on comparisons against updated clear-sky spectral trajectory signatures along with other verification metrics.
4.4. Reference Sampling and Radiometric Harmonization
At its core, the Cubesat-Enabled Spatio-Temporal Enhancement Method (CESTEM) serves as a flexible mechanism to radiometrically harmonize multi-sensor spectral data into a consistent radiometric surface reflectance standard (for example, the "gold standard"). The FORCE-based surface reflectance product (30 m) (Table 1; FLS-SR) is currently adopted as the gold standard. CESTEM is characterized by a number of unique features:
- Does not require day co-incident acquisitions (PS versus L8/L9/S-2) for cross-calibration/harmonization
- Implements a secondary MODIS/VIIRS-based harmonization to correct for surface reflectance changes occurring over given PS and L8/L9/S-2 acquisition time spans
- Reduces uncertainties associated with both PS and L8/L9/S-2 data via carefully assigned image quality weights and temporally-driven anomaly detection
- Can harmonize data from sensors with contrasting spectral bands and Relative Spectral Responses
- Is largely insensitive to noise (such as calibration uncertainties) in the input data (such as PS-TOA)
- Does not require PS inputs to be atmospherically corrected and is agnostic to PS input type (for example, should work equally well with either DNs, TOA radiances, or TOA reflectances)
- The calibration model is locally constrained (for example, specific to each PS tile-level image domain) and therefore much less prone to overfitting and portability issues (such as "hallucinations") relative to more generic AI driven model implementations
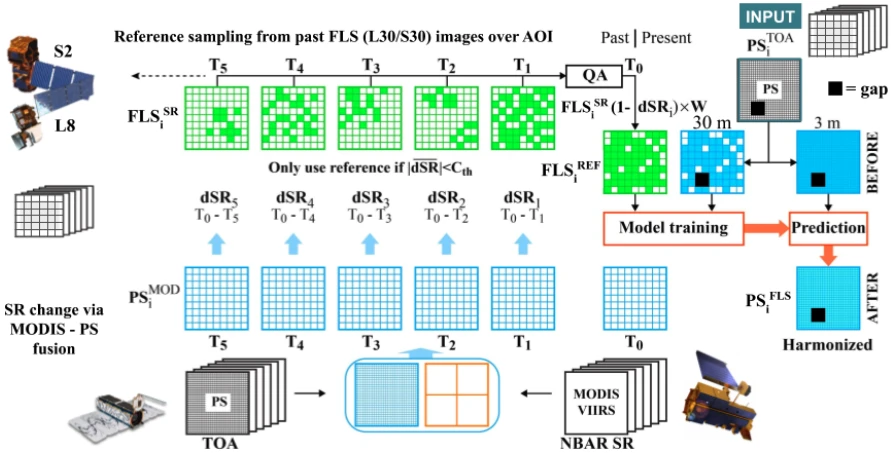
Figure 8: Diagram of the CESTEM radiometric harmonization framework, translating image stacks of PlanetScope TOA radiance (PS^TOA) into FORCE-consistent (Landsat 8/9/Sentinel-2) Surface Reflectance (PS^FLS).
The CESTEM-based harmonization (step 6, Figure 5, Figure 8) is applied to all PlanetScope images acquired over a defined Time Of Interest (TOI) drawing spectral reference data (for example, blue, green, red, and NIR) from a pool of FORCE L8/L9/S-2 SR (FLS-SR) images acquired over a predefined "calibration window" (typically one year centered around the TOI). In order to reliably use past or "future" FLS-SR images for calibration purposes they must be associated with a day-coincident PS acquisition. Critical to this process is the use of MODIS/VIIRS-consistent (for example, MCD43/VNP43) PlanetScope data (PSMOD) to quantify relative surface reflectance changes over given PS – FLS acquisition time spans (Figure 8). It follows that data from multiple FLS acquisitions will be sampled to generate a given PS coincident calibration reference image (FLS^REF), using composite weights derived as a function of image quality, PS – FLS acquisition time spans, and the magnitude of surface reflectance change relative to the prediction day (Figure 8). The image quality weight is a function of scene quality ("standard" vs "test"), cloud, haze, and snow percentages, daily aerosol optical depth (AOD) from MODIS (see Section 4.2), and sun elevation difference between the Landsat/Sentinel-2 and PlanetScope acquisition times. The image quality weights help ensure that the highest quality FLS – PS pairs are weighted the most during the harmonization process, reducing uncertainties resulting from atmospheric correction uncertainties, BRDF effects, and residual cloud and haze contamination. In addition, the multi-temporal FLS inputs are further quality assured (QA) during the sampling step and outliers are removed. Importantly, the calibration scheme can handle significant lags between the PS imagery to be harmonized and suitable FLS images as the calibration references can be sampled from images in the past or future (relative to the prediction date). As a result, the harmonization approach will continue to perform well over extended periods of cloudiness and FLS unavailability as long as a sufficient number of good FLS scenes can be identified within the "calibration window".
The multi-sensor and multi-time sampling approach (Figure 8), along with the associated weights, reduces potential issues and uncertainties (such as atmospheric contamination, cloud masking, BRDF effects, calibration inaccuracies) associated with both the PS and FLS data to create a very robust and temporally consistent radiometric reference. With this in place, a multivariate linear regression and decision tree approach (Houborg and McCabe 2018a) is employed to learn non-linear tile-, sensor-, and band-specific translational associations. The resulting models are then used to convert PS TOA (PS^TOA) reflectances into FLS-consistent SR (PS^FLS). During this process, a number of techniques are implemented to avoid overfitting and to preserve band-specific textural features and spatial gradients present in the original 3 m PS imagery.
The CESTEM-based radiometric harmonization framework has been designed to be highly self-contained with "on-the-fly" radiometric correction models adapted to the characteristics of a specific sensor, satellite strip, and local (tile-level) surface and atmospheric conditions on any given prediction date. As such the framework is designed to effectively and accurately create sensor agnostic analysis ready data from distributed (virtual) sensor constellations. The framework is largely insensitive to temporal inconsistencies ("noise") associated with the input data (PS^TOA), which may result from calibration uncertainties and cross-sensor spectral differences. In fact, as showcased in Figure 9, adding significant random temporal noise to the PS input data has a largely indistinguishable impact on the harmonized results. Another noteworthy feature is the low sensitivity to inaccuracies associated with the reference Sentinel-2 data (Figure 9), in this case mostly resulting from cloud omission errors in the FORCE-based Sentinel-2 data.
The CESTEM-based harmonization typically relies exclusively on clear-sky pixels across the tile domain to inform model training. However, if the clear-sky percentage is less than 0.5% any available haze contaminated pixels will be included in the model training. ARPS data will be unavailable for tiles that have less than 100 clear-sky or haze pixels.
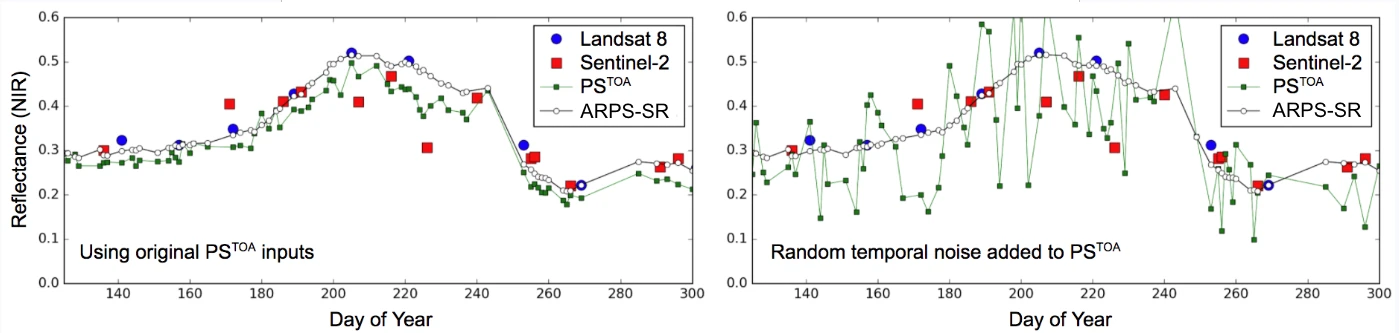
Figure 9: Illustration of the robustness of the CESTEM radiometric harmonization to noise in the input data streams (FLS and PS).
4.5. Geometric Harmonization
The imagery used in making Analysis-Ready PlanetScope (such as PS, L8/9, S-2) has been orthorectified using rigorous preprocessing protocols with a positional accuracy typically better than 10 m RMSE. Nevertheless, perfect image to image alignment is difficult to achieve, particularly when combining data from disparate sensor sources. As ARPS relies heavily on taking advantage of temporal information content for cloud masking and calibration, precise co-registration and sub-pixel fine alignment of stacked imagery becomes a necessity.
ARPS uses an implementation of the phase cross correlation technique (Guizar-Sicairos et al., 2008) to robustly detect the global shift between two images with sub-pixel precision at various processing stages. Geometric harmonization/co-registration is applied to: 1) PS scenes during the satellite strip to tile conversion step (step 3/4, Figure 5), 2) PSMOD and FLS-SR imagery stacks (step 5, Figure 5), and 3) the CESTEM calibrated (CESTEM-SR) imagery stack (step 7, Figure 5).
Sub-pixel shifts (y, x) are derived based on the overlapping clear-sky domain between a source (to be shifted) and reference/anchor image on a per-band basis. The shifts are evaluated independently in multiple image subsets distributed within the clear-sky overlap region of the two images. An optimal set of image subsets are defined by optimizing the clear-sky data percentages (as close to 100% as possible) and the band-specific cross-correlation. The cross-correlation constraint serves to identify subsets with good alignment features and to reduce the impact of any residual contamination. It follows that the number and sizes of the subsets may vary significantly as a function of the clear-sky percentage of the images. Images with significant cloud cover will typically be characterized by smaller subsets to fit within the clear-sky pixel "pockets". As the subset must be gap-free to enable sub-pixel precision in the shifting estimates, the subset domain will be down-adjusted iteratively until that is achieved or the minimum domain size is reached. In the latter case, small remaining gaps will be filled via nearest neighbor interpolation to not lose the sub-pixel precision. If gaps still remain, shifts will not be derived for the given subset. The "global" (for example, tile-level) shift estimate will be based on an average of the subset-level shift estimates after outlier removal. If the derived shifts are within acceptable limits they will be applied to the source image using a Fourier transformation approach. Final acceptance of the shifted image will depend on a series of cross-correlation checks to verify that the spatial correlations between the source and reference image actually improved as a result of the pixel shift adjustments. Non-passing cross-correlation checks may indicate challenges associated with deriving a robust shift estimate due to image quality issues and/or scene registration issues leading to non-global shifts at the tile-level. While the shifts are derived on a per-band basis, the final shift estimate will be based on the average of each band-specific shift given the generally high accuracy (~0.25 pixels for SuperDove) of the PlanetScope band-to-band alignment (Planet Team 2023).
Geometric harmonization is first enforced when creating the tile-level image as it may combine multiple scenes from the same PlanetScope sensor (for example, a satellite strip), which may sometimes be slightly mis-aligned. The clear-sky overlap within a strip (for example, a strip signifies the set of scenes acquired from a single satellite in a single pass) is used to assess the sub-pixel shifts as described above. If the shifts are deemed valid they will be applied (using the Fourier transformation approach) to help ensure that the PlanetScope scenes within the tile are geometrically harmonized (aligned) before merging. However, it will not correct for mis-alignments within the scene due to registration issues when creating the scene composite from raw frames (done upstream of ARPS processing). This approach is applied to both PS-TOAR and PSMOD product artifacts during tile-level stacking (Figure 5).
The 30 m stacked PSMOD and FLS-SR product artifacts are bundle-adjusted using a series of "moving" geometric reference images. The reference images are generated by averaging predominantly clear-sky high quality PSMOD images acquired within partly overlapping moving time periods distributed across the full processing TOI. A minimum number of contributing PSMOD images will be enforced for this purpose to help ensure robust and gap-free reference images. The contributing time window may be expanded if needed to make enough candidate images available. Subsequently, each stacked PSMOD and FLS-SR image is aligned against the closest reference image using the sub-pixel shift derivation approach outlined above.
The CESTEM calibrated (CESTEM-SR) imagery stack (3 m) is bundle-adjusted in a similar manner. In this case, the dynamic ("moving") geometric reference images will be generated by blending/averaging a minimum of 10 multi-temporal candidate (such as clear-sky, high quality) CESTEM-SR images acquired over partly overlapping moving time periods across the full processing TOI. Pixel-level outliers will be flagged and removed before generating the geometric reference images. Then each individual CESTEM-SR image is aligned against the closest reference image as described above.
In some cases, pixels at the borders of scenes will be marked "suspect" in the QA product's cloud mask where sub-pixel shifting may have introduced additional uncertainty into those pixels' radiometry.
4.6. Merging of Satellite-Specific Processing Chunks
The radiometric and geometric harmonization steps described above are done independently for each satellite-specific strip (for example, a strip signifies the set of scenes acquired from a single satellite in a single pass) on any given date, resulting in a series of fully harmonized, date and satellite-specific processing chunks spanning the requested TOI. Often, more than one PlanetScope scene/strip may be contributing to the same date-specific image domain, and the satellite-specific processing chunks available on a given date are merged to produce the final tile-based ARPS product artifacts (step 8, Figure 5). The default approach is a best-scene-on-top priority stacking approach when merging the available clear-sky observations across the different processing chunks. The prioritization weights are established as a function of image quality, calibration robustness, and cloud contamination. Outlier detection and masking will be enabled if more than two clear-sky observations (for example, from different PS satellites) are available on a given date. The high radiometric consistency between the satellite-specific sources helps ensure consistency in the merged output but a weighted blending technique across transition zones is also adopted to ensure seamless transitions between clear-sky domains originating from different satellite sources.
A different best-on-top prioritization protocol is used for the domain that is cloudy across all of the satellite-specific processing chunks. The adopted protocol will prioritize those cloud-contaminated pixels that are most likely to retain surface recoverable information. As a result, pixels identified as haze will be assigned the highest priority whereas pixels identified as bright clouds will be assigned the lowest priority. See Table 6 for the complete priority order.
Table 6: Priority order for selecting contaminated pixels when merging satellite-specific processing chunks.
| Priority order | Class name | Class label |
|---|---|---|
| 1 | Haze | 4 |
| 1 | Other contamination | 6 |
| 2 | Cloud shadow | 3 |
| 2 | Adjacent clouds | 5 |
| 3 | Suspect | 7 |
| 3 | Bright clouds | 2 |
While this prioritization scheme will attempt to preserve potentially useful pixel information (such as pixels detected as haze), the merging of cloud contaminated pixels from different sources can sometimes lead to transition artifacts in the final product artifacts. The transition between clear-sky and cloud contaminated pixels will be abrupt (for example, not seamless) as the cloud detected pixels are not to cross-contaminate the clear-sky domain. Similarly, there may be transition artifacts between different contaminated domains (such as bright cloud and haze) depending on which scenes have been prioritized within the contaminated domain.
The raster-based cloud mask and pixel traceability data for the Analysis-Ready PlanetScope Quality Assurance product (Section 3.2) is also generated at this step. In addition, non-raster metadata is gathered and embedded in the tiff header (Table 5) of the QA product artifacts. This will include pixel-level information on contributing PlanetScope scenes and their overlapping contribution footprints. Some of the satellite-specific scenes may have been flagged with "bad geometry" or "bad radiometry" during the harmonization steps, and if they end up contributing to the final tile image, it will be indicated in the embedded metadata (see Table 5). Scenes identified as "bad" will only be included if there is no "validated" scene data available to fill the tile. The fact that the final tile-based product artifacts may include "bad" scene data makes it critically important for the users to use the associated QA information to determine the quality and usefulness of the data and apply relevant masking before application.
Finally, it is worth noting that the final ARPS product artifacts will only be populated with data if there is at least some clear-sky (or haze) pixels present (for example, currently enforcing a minimum clear-sky/haze percentage of 5%). Haze contaminated pixels have been included in this condition as those pixels may have some useful surface recoverable information. For the largest tile grid (Section 3.4), a quadrant-level processing scheme (for example, each tile is divided into four equally-sized chunks) is adopted for optimization purposes. As the clear-sky percentage threshold is enforced at the quadrant-level, it is possible to have tiles with one or more quadrants completely filled with no data.
4.7. Backfill Versus Forward-Fill Operation
Analysis-Ready PlanetScope can be processed in either backfill or forward-fill mode. Backfill signifies a run over a time of interest in the past. ARPS data creation always starts by processing at least one year of historical data, even if a shorter backfill (or no backfill) has been requested. This is necessary to establish deep temporal image stacks to inform the cloud masking, calibration, and harmonization processes. Forward-fill jobs are executed subsequent to a backfill operation and typically run as close to present time as possible and typically on a daily basis, processing any new imagery that has become available since the last job execution utilizing information from the deep temporal stacks generated during the backfill for cloud masking, and calibration purposes. Currently a 48 hour latency of delivering ARPS data during daily1 forward-fill operation is targeted, which is a function of the latency of the input sources (for example, primarily PlanetScope and MODIS/VIIRS) and processing time.
Various factors may cause differences in product quality between forward-fill and backfill operation. Forward-fill typically involves near real-time (NRT) data processing and the inherent latencies in satellite data and FORCE processing can cause S-2 and/or L8/9 scenes acquired close to the prediction date to not be available to inform the calibration process. While the multi-temporal calibration approach should continue to perform well based on FORCE data acquired in the past relative to the prediction date, the inclusion of the most current (relative to the prediction date) information will tend to be beneficial. The temporally driven cloud detection approach will also benefit from having data available both before and after the prediction date to most effectively detect anomalies attributable to cloud, cloud shadow, or haze contamination. In daily forward-fill, the anomaly detection is based mostly on backwards looking imagery (for example, only data from one day in the future of the prediction day will be available at most), which can increase the risk of commission or omission errors in the cloud mask. Finally, in forward-fill (or when running ARPS within 9 days of present day) NRT MODIS or VIIRS surface reflectance products will be used instead of the standard products (Section 2). The NRT MODIS/VIIRS products rely on backwards looking data alone to inform the BRDF correction and may therefore be less representative of prediction date surface conditions. While a bias correction procedure has been implemented to remedy this potential issue, the generally lower quality NRT MODIS/VIIRS data may impact the quality of the MODIS/VIIRS-based surface reflectance harmonization (Figure 5), which in turn may impact the accuracy of the CESTEM-based radiometric harmonization.
5. Known Limitations and Caveats
-
False cloud/shadow detections may occur in certain cases: 1) if surface conditions change very rapidly, 2) during prolonged cloudiness, or 3) over AOIs with complex terrain and shadowing. Significant effort has gone into developing automated techniques to differentiate between actual change and atmospheric contamination, but in some cases commission errors can still be an issue.
-
Analysis-Ready PlanetScope is not suited for studies over snow covered surfaces. As it is virtually impossible to robustly distinguish between snow and clouds based on 4-band VNIR data, periodic snow cover will in most cases be masked out as clouds. Because the radiometric harmonization relies on clear-sky data, snowy regions may have reduced radiometric quality, or be completely unavailable if no clear-sky regions were identified.
-
The Analysis-Ready PlanetScope processing focuses on getting surface reflectance values correct for ground pixels, not clouds. In most cases, clouds will have a natural appearance, but occasional discoloration may occur over clouds in the image. This effect is not known to be associated with any errors in radiometric harmonization over ground pixels.
-
As the Analysis-Ready PlanetScope processing is done independently for each tile, tile boundary artifacts can sometimes occur within AOIs which cross tile boundaries. This may be manifested in the form of typically small inter-tile brightness differences and sub-pixel mis-alignments.
-
Lastly, the notion of a perfect product is utopian. Remote sensing is hard. Cloud masking is a balancing act and an unwinnable battle between commission and omission errors. There WILL be cases where ARPS does not perform as well as we want it to. A lot of effort has gone into developing a differentiated next generation surface reflectance product with an ambition to be "best in class". We are committed to continuously improving it towards realizing the promise of high fidelity, timely, usable, and actionable insights from multi-source satellite observations.
References
M. Claverie, J. Ju, J.G. Masek, J.L. Dungan, E.F. Vermote, J.-C. Roger, S.V. Skakun, C. Justice. 2018. The Harmonized Landsat and Sentinel-2 surface reflectance data set. Remote Sensing of Environment, 219, 145-161: https://doi.org/10.1016/j.rse.2018.09.002
G. Doxani, E. Vermote, J.-C. Roger, F. Gascon, S. Adriaensen, D. Frantz, O. Hagolle, A. Hollstein, G. Kirches, F. Li, J. Louis, A. Mangin, N. Pahleva, B. Pflug, Q. Vanhellemont. 2018. Atmospheric Correction Inter-Comparison Exercise. Remote Sens., 10(2), 352: https://doi.org/10.3390/rs10020352
G. Doxani, E.F. Vermote, J.-C. Roger, S. Skakun, F. Gascon, A. Collison, L. De Keukelaere, C. Desjardins, D. Frantz, O. Hagolle, M. Kim, J. Louis, F. Pacifici, B. Pflug, H. Poilvé, D. Ramon, R. Richter, F. Yin. 2023. Atmospheric Correction Inter-comparison eXercise, ACIX-II Land: An assessment of atmospheric correction processors for Landsat 8 and Sentinel-2 over land. Remote Sensing of Environment, 285, 113412. https://doi.org/10.1016/j.rse.2022.113412
ESA. 2024. The European Space Agency. Available online: https://sentiwiki.copernicus.eu/web/s2-mission (accessed on 12 May 2024)
D. Frantz. 2019a. FORCE—Landsat + Sentinel-2 Analysis Ready Data and Beyond. Remote Sensing, 11, 1124: https://doi.org/10.3390/rs11091124
D. Frantz, M. Stellmes, P.A. Hostert. 2019b. Global MODIS Water Vapor Database for the Operational Atmospheric Correction of Historic and Recent Landsat Imagery. Remote Sens., 11, 257. https://doi.org/10.3390/rs11030257
D. Frantz, E. Haß, A. Uhl, J. Stoffels, J. Hill. 2018. Improvement of the Fmask algorithm for Sentinel-2 images: Separating clouds from bright surfaces based on parallax effects. Remote Sens. Environ., 215, 471–481: https://doi.org/10.1016/j.rse.2018.04.046
R. Houborg, M.F. McCabe. 2018a. Daily Retrieval of NDVI and LAI at 3 m Resolution via the Fusion of CubeSat, Landsat, and MODIS data. Remote Sensing, 10(6), 890: https://doi.org/10.3390/rs10060890
R. Houborg, M.F. McCabe. 2018b. A Cubesat Enabled Spatio-Temporal Enhancement Method (CESTEM) utilizing Planet, Landsat and MODIS data. Remote Sensing of Environment, 209, 211-226: https://doi.org/10.1016/j.rse.2018.02.067
M. Guizar-Sicairos, S.T. Thurman, J.R. Fienup. 2008. Efficient subpixel image registration algorithms. Optics Letters 33, 156-158: https://doi.org/10.1364/OL.33.000156
J.W. Rouse, R.H. Hass, J.A. Shell, D. Deering. 1973. Monitoring vegetation systems in the Great Plains with ERTS-1. In: Third Earth Resources Technology Satellite Symposium. Washington DC, pp. 309–317
D.P. Roy, H.K. Zhang, J. Ju, J.L. Gomez-Dans, P.E. Lewis, C.B. Schaaf, Q. Sun, J. Li, H. Huang, V. Kovalskyy. 2016. A general method to normalize Landsat reflectance data to Nadir BRDF Adjusted Reflectance. Remote Sensing of Environment, Vol. 176, pp 255–271: https://doi.org/10.1016/j.rse.2016.01.023
D.P. Roy, J. Li, H.K. Zhang, L. Yan, H. Huang, Z. Li. 2017. Examination of Sentinel-2A multi-spectral instrument (MSI) reflectance anisotropy and the suitability of a general method to normalize MSI reflectance to nadir BRDF adjusted reflectance. Remote Sensing of Environment, Vol. 199, pp 25-38: https://doi.org/10.1016/j.rse.2017.06.019
D.P. Roy, H. Huan, R. Houborg, V.S. Martins. 2021. A global analysis of the temporal availability of PlanetScope high spatial resolution multi-spectral imagery. Remote Sensing of Environment, Vol. 264, 112586: https://doi.org/10.1016/j.rse.2021.112586
C.B. Schaaf, F. Gao, A.H. Strahler, W. Lucht, X. Li, T. Tsang, N.C. Strugnell, X. Zhang, Y. Jin, J.-P. Muller et al. 2002. First operational BRDF, albedo nadir reflectance products from MODIS. Remote Sens. Environ., 83, 135–148: https://doi.org/10.1016/S0034-4257(02)00091-3
D. Tanré, C. Deroo, P. Duhaut, M. Herman, J.J. Morcrette, J. Perbos, P.Y. Deschamps. 1990. Description of a Computer Code to Simulate the Satellite Signal in the Solar Spectrum: The 5S Code. Int. J. Remote Sens., 11, 659–668: https://doi.org/10.1080/01431169008955048
Z. Zhu, C.E. Woodcock. 2012. Object-Based Cloud and Cloud Shadow Detection in Landsat Imagery. Remote Sens. Environ., 118, 83–94: https://doi.org/10.1016/j.rse.2011.10.028
Planet Team, 2023. Planet L1 Data Quality Q4 2023 Report. Status of Calibration and Data Quality for the PlanetScope Constellation, December 2023, Available online at https://support.planet.com/hc/en-us/articles/360037649554-L1-Data-Quality-Reports-for-the-PlanetScope-Constellation. Last Accessed: May 13, 2024
S.A. Soenen, D. R. Peddle and C. A. Coburn. 2005. SCS+C: a modified Sun-canopy-sensor topographic correction in forested terrain. IEEE Transactions on Geoscience and Remote Sensing, vol. 43, no. 9, pp. 2148-2159: https://doi.org/10.1109/TGRS.2005.852480
P.M. Teillet, B. Guindon, D.G. Goodenough. 1982. On the slope-aspect correction of multispectral scanner data. Canadian Journal of Remote Sensing, 8 (2), pp. 82-106.