Technical Specification
Sales for Planet’s 20m and 100m Land Surface Temperature products have been discontinued. Their technical specification is available under Enhanced Resolution.
Overview
Land surface temperature (LST) represents the thermodynamic temperature of Earth's surface and characterizes the radiative temperature emitted by the surface, offering insights into surface energy fluxes and interactions with the atmosphere.
The Earth's surface absorbs solar radiation, leading to the heating of the land while the temperature emitted by the surface varies as a result of the heterogeneity of the meteorological forcing, land cover, soil and vegetation water content, surface radiative properties and topography. Therefore, LST is highly variable in both space and time (Prata et al., 1995). Because of the high spatio-temporal variability, LST derived from satellite data offers several advantages over in situ LST measurements such as global availability, consistency and spatially distributed measurements leading to a cost-effective and efficient data stream.
The information provided is the temperature from a satellite’s point of view. Thus, the "surface" is whatever the sensor sees when it looks through the atmosphere to the ground, for instance, top of the canopy for vegetated areas, soil for non-vegetated areas or roof in urban environments. Therefore, LST is not the same as the air temperature that is included in the daily weather report. LST can provide insights on a variety of applications: evaporation monitoring (Miralles et al., 2011), climate change studies (IPCC, 2021), soil moisture estimation (Merlin et al., 2008), vegetation monitoring (Kogan, 2001), urban studies (Voogt and Oke, 2003), to name a few.
The Planet Land Surface Temperature product provides a measurement of the Earth’s skin temperature at a global level. By combining overlapping observations from multiple public satellite sensors that measure passive microwave radiation from the earth surface, Planet creates downscaled LST observations. Initial observations represent several kilometers of the Earth’s surface in any given pixel of data, but the Planet patented algorithm enhances the spatial resolution of the passive microwave observations.
Planet offers a long archive product since 2002, with the following features:
- Available within 6 to 12 hours after the microwave satellite overpass for timely decision-making
- Available twice a day: at 01.30 and 13.30 solar local time
- Not hindered by clouds, leading to continuous and consistent feed of observations
- Accurate over the majority of land surface, with the exception of snow and frozen areas
- Based on a proprietary method to provide data at improved spatial resolution
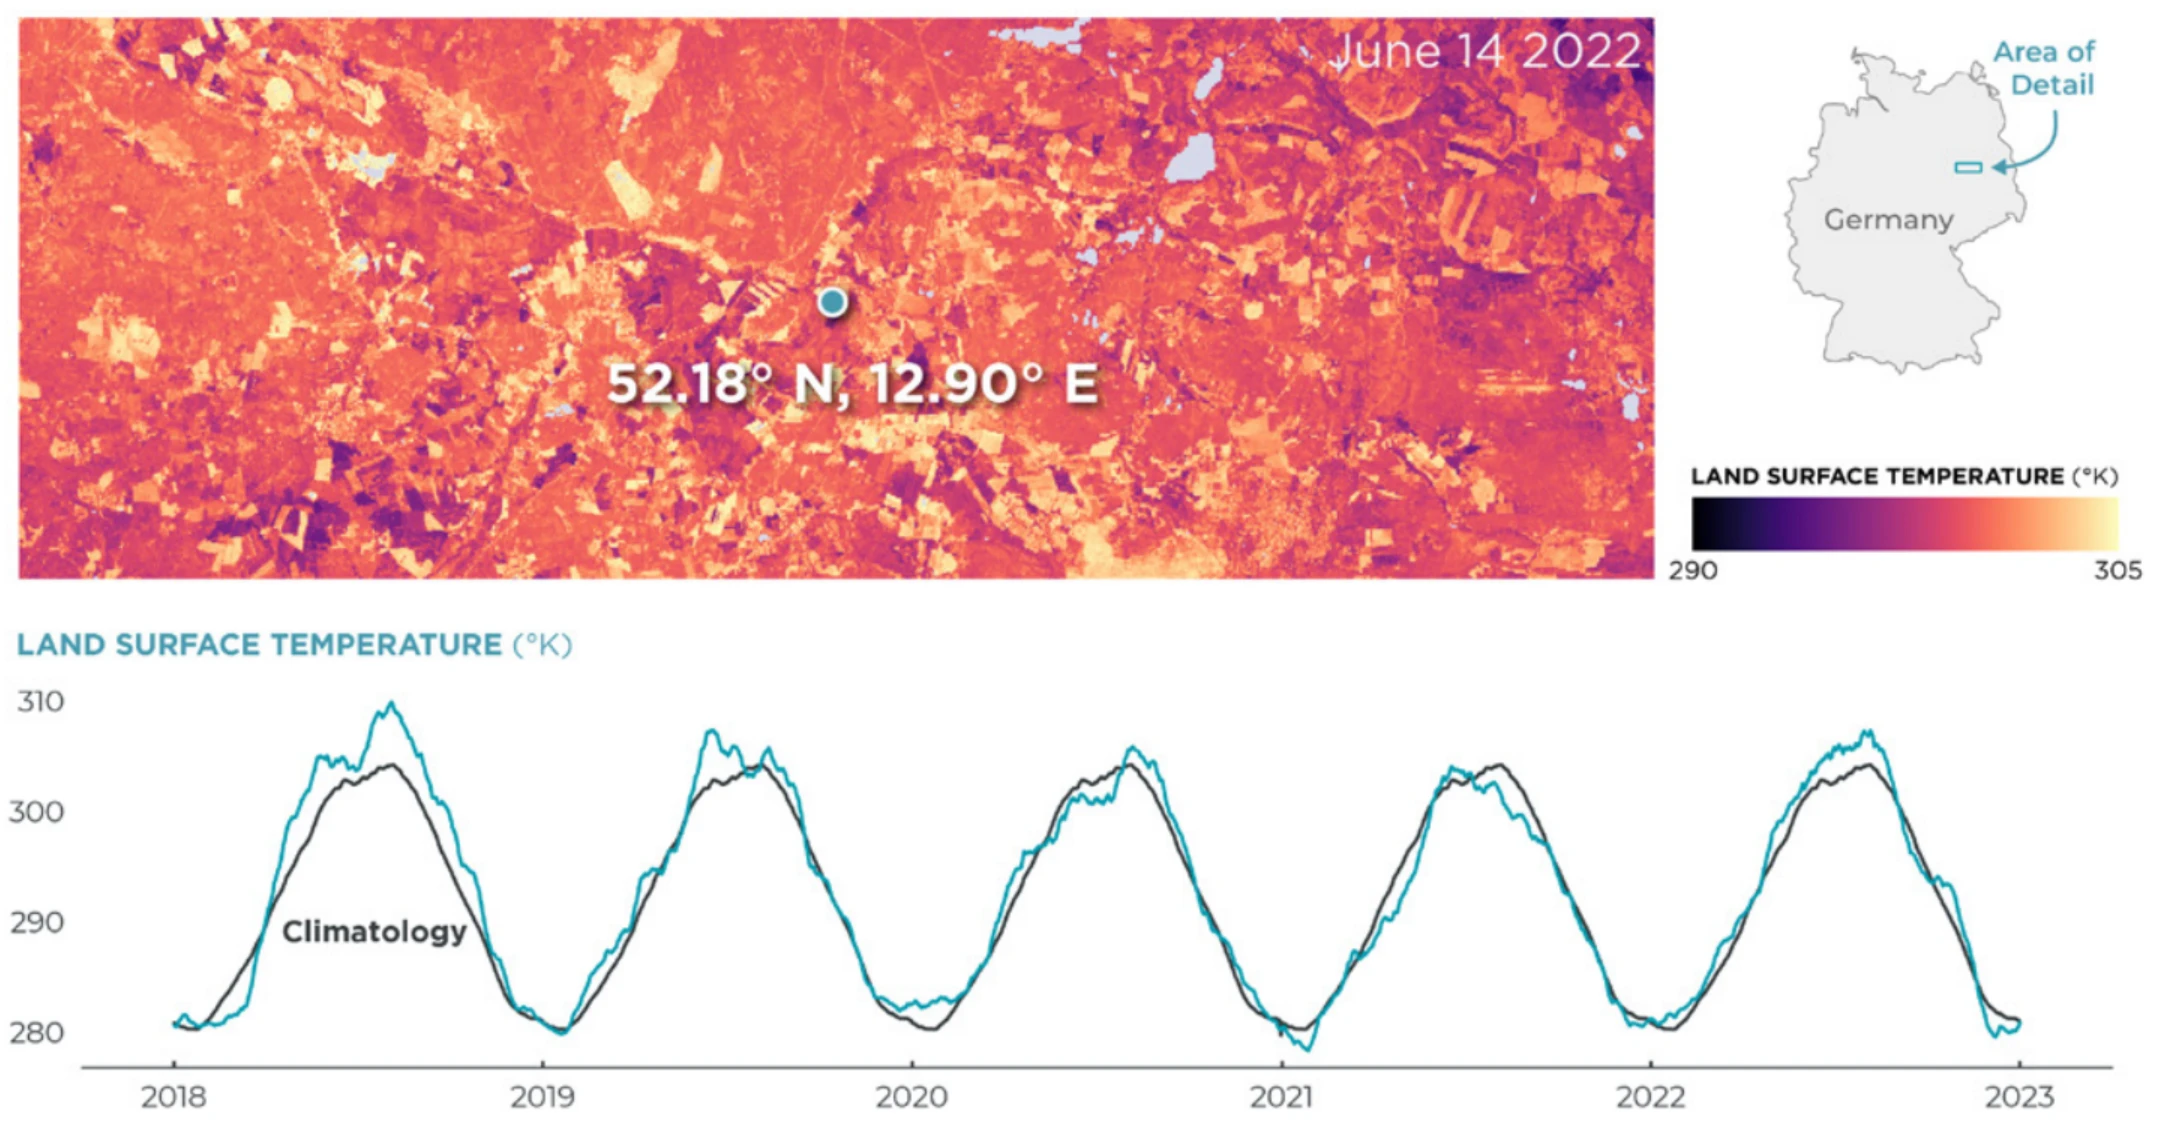
Figure 1: Measurements of Land Surface Temperature southeast of Berlin, Germany. The image above represents the skin temperature from a single day. Below, the measurements of Land Surface Temperature of a single point are plotted over 5 years with the baseline climatology, showing how temperature levels compare to the expected average for the area.
Product Specifications
Table 1: LST product specification
| Data Resource | LST 1000 m |
|---|---|
| Source ID | LST-AMSR2_V1.0_1000 (2012 - present) LST-AMSRE_V1.0_1000 (2002-2011) |
| Version | 1.0 |
| Unit | Kelvin |
| Pixel Size | 0.00901° (±1000x1000 m) |
| Temporal Resolution | 0° latitude: 205 to 228 observations per overpass time per year 40° latitude: 274 to 292 observations per overpass time per year |
| Overpass Time | 01:30 and 13:30 local solar time |
| Geographical Coverage | Global |
| Data Availability | 2002-06-15 - Present Data gap: 2011-10-04 to 2012-07-25 |
| Satellites Used | AMSR-2, AMSR-E |
| NRT latency (p90) | 24 hours |
| Archive latency | Within 30 days after creating a subscription |
Asset Properties
Each LST observation is delivered as a LST data asset (*lst.tif) with metadata provided in a separate quality flag asset (*lst-qf.tif).
Table 2: Asset properties of LST data resources
| Asset Name | Band Name | Unit | Type | Typical Range | No Data Value | Scale | Format |
|---|---|---|---|---|---|---|---|
| lst | Band 1 | kelvin | UINT16 | 263 - 340 | 65535 | 0.01 | GeoTIFF |
| lst | Band 2 | kelvin | UINT16 | 250 - 360 | 65535 | 0.01 | GeoTIFF |
| lst-qf | Band 1 | unitless | UINT16 | NA | 0 | 1 | GeoTIFF |
You can find below a Python code snippet that converts a temperature from Kelvin to Celsius and Fahrenheit:
def kelvin_to_celsius(kelvin):
    return kelvin - 273.15

def kelvin_to_fahrenheit(kelvin):
    celsius = kelvin - 273.15
    return (celsius * 9/5) + 32
Methodology
Passive Microwaves and Downscaling Method
The Ka band (±36.5 GHz) vertical polarized brightness temperature is used to derive LST because it is considered the most appropriate microwave frequency for temperature retrieval. This channel balances a reduced sensitivity to soil surface characteristics with a relatively high atmospheric transmissivity. It is shown that with a simple linear relationship, accurate values for LST can be obtained from this frequency Holmes et al., 2009.
The downscaling patented technology (US10643098, EP3469516B1) aims to improve the resolution of sensor data, in this case, the brightness temperatures observed by passive microwave sensors. The technique redefines the exact geolocation and reconstructs the antenna footprints of each observation. It uses the abundance of overlaps between these footprints for downscaling at a target resolution. Based on the footprint center, microwave frequency, incidence angle, azimuth angle, and footprint size for a given intensity, footprints are created and disaggregated in equal interval ellipses using an internal gaussian distribution. Within the ellipse-shaped footprints, the center of the footprint contributes more to the observed values than the edges. Water bodies will have a fixed value and will be considered; thus, the land brightness temperature can be retrieved more accurately. This method elucidates the exact source of the signal of each observation point. The output of the downscaling method is brightness temperature for a given frequency at the target resolution.
Input Data
Table 3: List of inputs for Land Surface Temperature production
| Product | Description |
|---|---|
| Brightness Temperature Ka band | AMSR-E and AMSR-2 Level-1B Radiometer Ka band Brightness Temperatures (downloaded from JAXA G-portal in HDF5 format). This Level-1B product provides calibrated estimates of geolocated brightness temperatures at 36.5 GHz with a footprint size of 7x12 km. Data has been available from July 2002 to October 2011 (AMSR-E) and from June 2012 (AMSR-2) up to now with a latency of 12 hours. Detailed information is available here. |
| Brightness Temperature W band | AMSR-E and AMSR-2 Level-1B Radiometer W band Brightness Temperatures (downloaded from JAXA G-portal in HDF5 format). This Level-1B product provides calibrated estimates of geolocated brightness temperatures at 89 GHz with a footprint size of 3x5 km. Data has been available from July 2002 to October 2011 (AMSR-E) and from June 2012 (AMSR-2) up to now with a latency of 12 hours. Detailed information is available here. |
| Digital Elevation Model | Digital elevation model (DEM) static map based on the Copernicus DEM GLO-90 product covering the full global landmass of the time frame of data acquisition (2011-2015). Detailed information is available in the link. |
| Land Cover Map | Custom global land classification including permanent water bodies based on the Copernicus Global Surface Water Bodies product from PROBA-V. Detailed information is available here |
Data Quality
Validation
We have evaluated our LST products by comparing them to carefully ground data stations and other remotely sensed LST data across various land cover types and climates regions.
You can read more about the results in this white paper.
Planet's LST product was validated over 114 locations from 2013-01-01 to 2022-12-31. We used an established network of in-situ stations from the United States Climate Reference Network (USCRN) and remotely sensed LST derived from MODIS AQUA. The Planet LST, MODIS AQUA 1 km LST and USCRN surface temperature were intercompared at 1:30 and 13:30, separately. The surface temperature at USCRN stations is measured over grassy or low vegetation (< 10 cm) surfaces and the stations cover many climatic and landscape conditions.
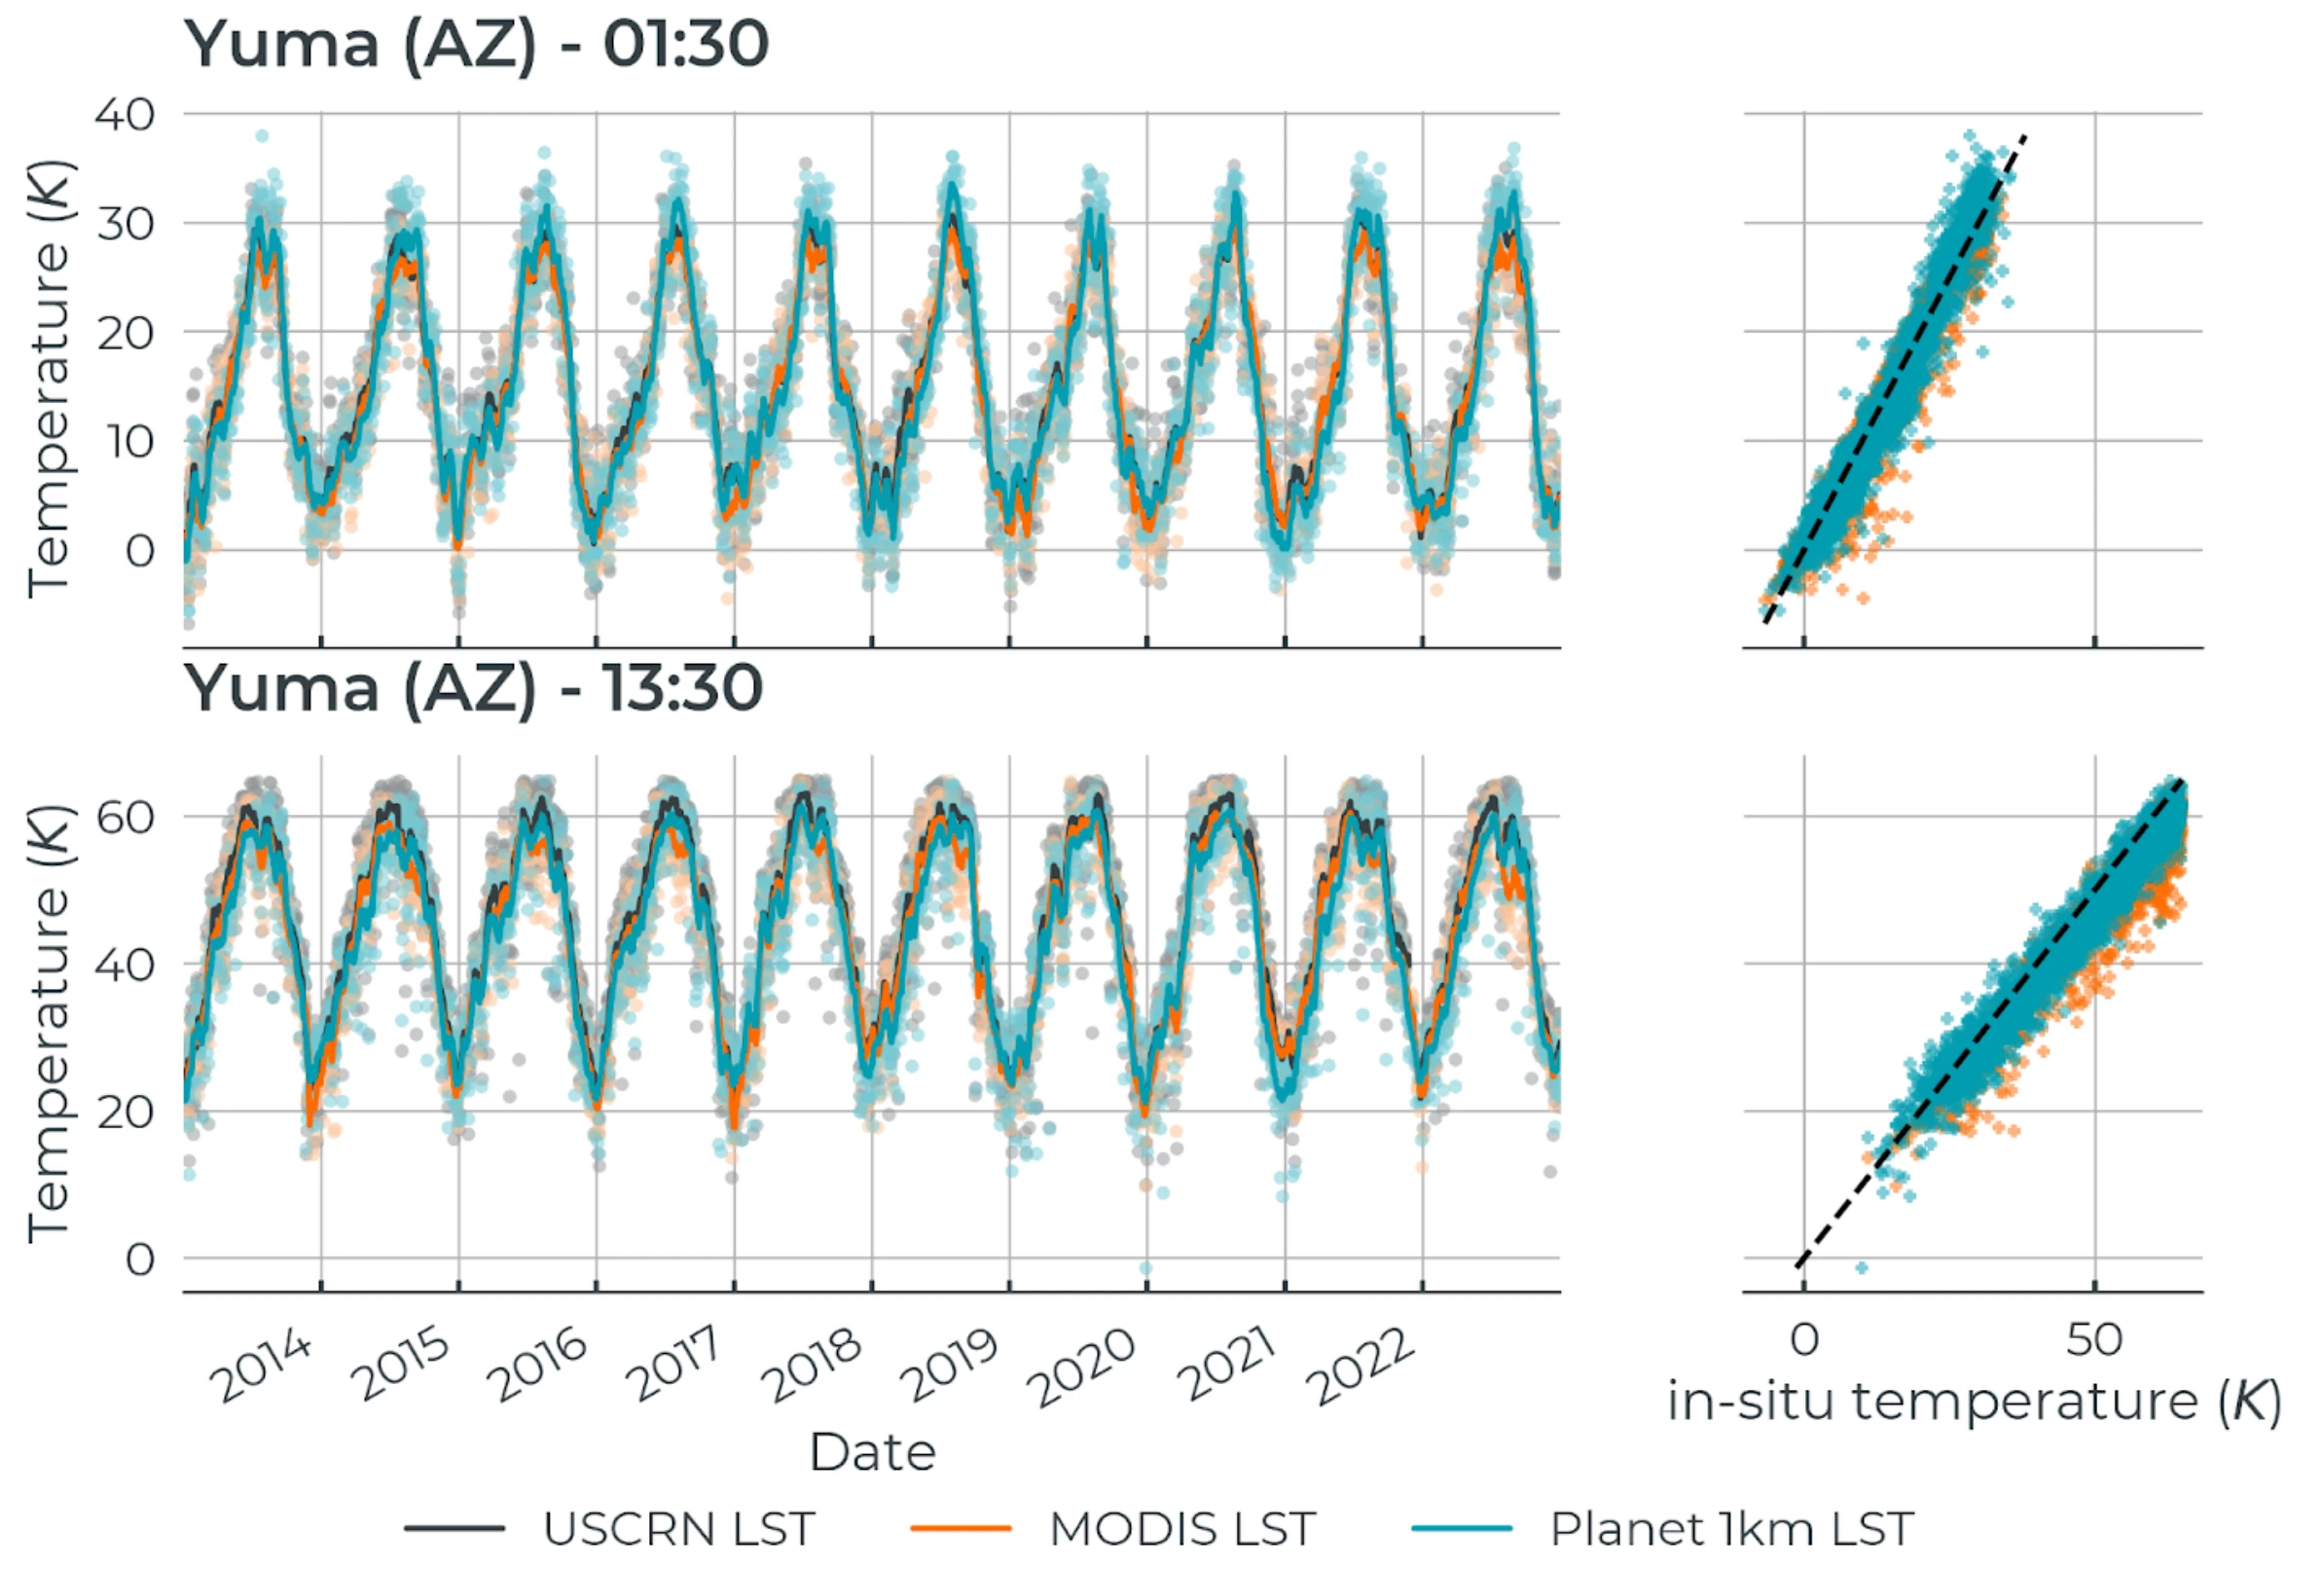
Figure 2: Time series of nighttime (upper figures) and daytime (lower figures) land surface temperature for the in-situ observations from the United States Climate Reference Network (USCRN), MODIS and Planet’s 1000 m products between 2013 and 2022 at the USCRN station Yuma (32.835, -114.1884), AZ, U.S. The scatterplots on the right compare single observations from MODIS’ and Planet’s LST against the in-situ observations for nighttime (Mean Absolute error (MAE) for MODIS: 1.28; MAE for Planet 1000 m: 1.83) and daytime (MAE for MODIS: 3.40; MAE for Planet 1000 m: 2.96).
Metadata
Quality flag assets (*lst-qf.tif) provide metadata for each pixel using bitwise flags. Critical flags indicate unreliable data, with corresponding pixels in band 1 of the LST asset (*lst.tif) set to the no data value. The replaced LST value can be found in band 2 of the LST asset. Non-critical flags indicate that the data can be used with caution, taking into account the flag description.
Critical and non-critical flags are described in the tables below. For more information on how to access the quality flag asset, check out subscribing to Planetary Variables.
Table 4: Non-critical flags
| Bit | Flag layer | Description |
|---|---|---|
| 4 | Possible severe precipitation | Part of the footprints touch an area flagged as severe precipitation. |
| 7 | Possible frozen soil | The surface may be frozen. These are pixels with a surface temperature between 263.15 K (-10°C) and 273.15 K (0°C). |
Table 5: Critical flags
| Bit | Flag layer | Description |
|---|---|---|
| 8 | Frozen soil | The surface is considered frozen. Pixels with a temperature below 263.15 K (-10°C). |
| 9 | Severe precipitation | Severe precipitation is detected. |
| 11 | No overpass | The satellite did not pass over. |
| 13 | Instrumental flaws | Unrealistic values due to instrumental flaws. If the brightness temperature at 36.5 GHz V produces values either over 400K or under 0.9 * the water temperature, the data is considered as unrealistic and is removed. |
| 14 | Out of valid range | Land Surface Temperature values are outside the valid range, meaning under 250 K or above 340 K. |
| 15 | Open water | Land Surface Temperature is not defined over water (retrieved from a land cover map). This data is filtered out during the processing of the raw satellite data. |
Here is a Python script to convert a quality flag pixel value into a list of corresponding quality flags. Note that one pixel may have multiple flags applied to it.
# lst_quality_flags.py

import argparse

LST_QUALITY_FLAGS = {
    4: "Possible severe precipitation",
    7: "Possible frozen soil",
    8: "Frozen Soil (critical flag)",
    9: "Severe precipitation (critical flag)",
    11: "No overpass (critical flag)",
    13: "Instrumental flaws (critical flag)",
    14: "Out of valid range (critical flag)",
    15: "Open water (critical flag)",
}


def convert_to_quality_flags(decimal_value: int) -> list[str]:
    binary_string = format(decimal_value, "016b")
    reversed_binary_string = binary_string[::-1]
    return [
        f"{i}. {LST_QUALITY_FLAGS.get(i, 'Unused flag')}"
        for i, bit in enumerate(reversed_binary_string, start=1) if bit == "1"
    ]


if __name__ == "__main__":
    parser = argparse.ArgumentParser(description="Convert a decimal value to quality flags.")
    parser.add_argument("decimal_value", type=int, help="The decimal value to convert.")
    args = parser.parse_args()

    flags = convert_to_quality_flags(args.decimal_value)
    print(*flags, sep="\n")
that you can call as follows, using value 8512 as example:
> python lst_quality_flags.py 8512
7. Possible frozen Soil
9. Severe precipitation (critical flag)
14. Out of valid range (critical flag)
Other Limitations
The following are some key limitations that we have not flagged:
- Data should be considered unreliable over sloped terrain that is over 20 degrees. The microwave signal can be distorted by the angle of the slope, causing changes in the observed brightness temperature. This distortion leads to inaccuracies in the Land Surface Temperature estimates because the algorithms assume a flat surface.
- Dynamic water bodies may cause unrealistic Land Surface Temperature estimates. Water bodies influence the microwave observations and without proper mitigation they could result in unrealistic retrievals.
- False cloud/shadow detections may occur if surface conditions change very rapidly, during prolonged cloudiness, or over AOIs with significant terrain and shadowing. Significant effort has gone into developing automated techniques to differentiate between actual change and atmospheric contamination, but there may still be false detections.
Frequently Asked Questions
What do you actually measure?
We measure the skin temperature of the first thing in the line of sight of the satellite. This can be a roof, a tarmac road, a tree or crop canopy, bare soil or a mixture of land cover types.
Do you measure the soil temperature?
No, we measure the temperature at the actual surface, the skin temperature. However, this is highly correlated to the soil temperature
How accurate is the data?
Accuracy of the data is comparable with existing Land Surface Products products such as MODIS but we provide higher resolution and more valid data points. Check the validation white paper for actual numbers.
How about frost use cases?
At the moment our LST should not be relied upon for below freezing point temperatures. Data below 263 kelvin (-10°C) is filtered out and data below 273 kelvin (0°C) should be treated with care.
What type of satellites are used to determine Land Surface Temperature?
Most of the signal is from the passive microwave satellites (AMSR-2 and AMSR-E). The passive microwave satellites measure microwave signals that are naturally radiating from the Earth’s surface. This enables observations to be acquired during cloudy conditions, because of the physical properties of waves transmitted in this spectrum’s range.
When is the data observed?
Currently, Planet uses the daytime and nighttime observations during the ascending and descending orbits, respectively. For AMSRE and AMSR2 this corresponds to 01:30 and 13:30 local solar time.
What is the coverage of the data in terms of observations?
Each of the microwave satellites are on a sun-synchronous orbit. Using both orbit directions (ascending and descending) we can retrieve LST up to twice a day. The observation coverage is less frequent around the equator, where the Earth is ‘widest’ around its longitude belt, and more frequent at high latitudes, where the longitude belts are less wide.
One can expect between 180 (at equator) and 365 (above 50°N) daytime and nighttime measurements per year, depending on the geographical location.
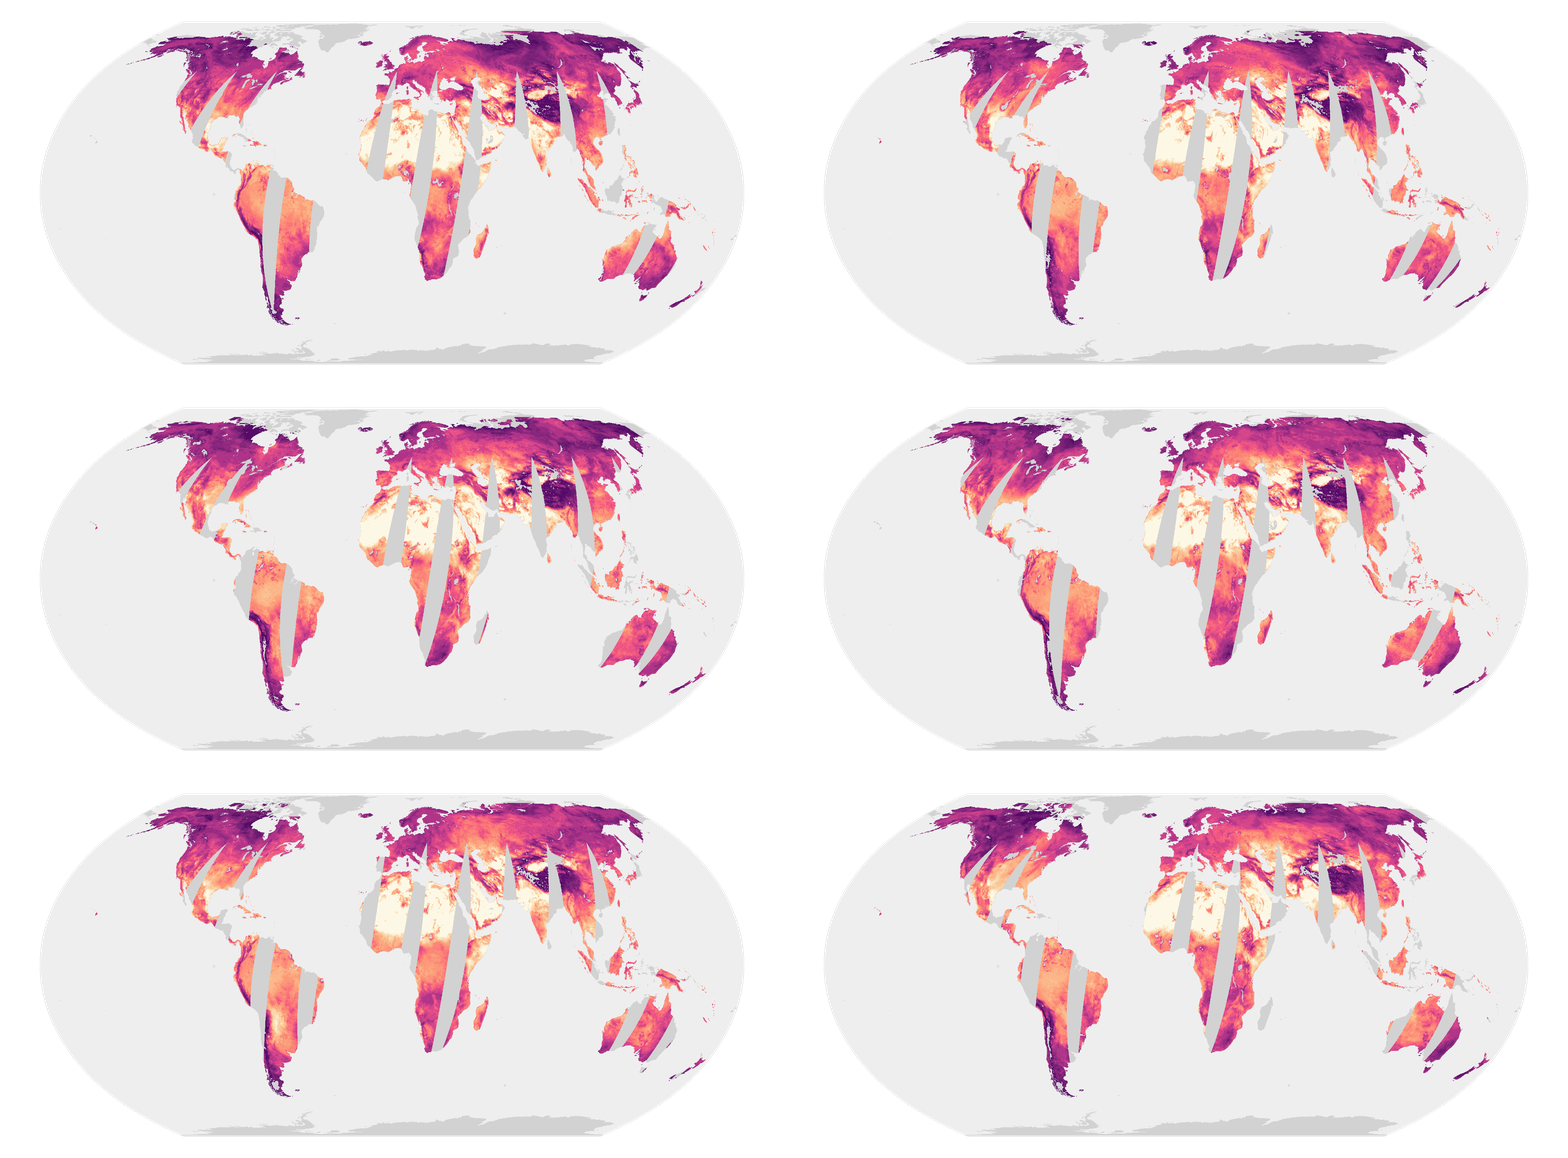
Land Surface Temperature animation of the 16-day AMSR2 cycle from 2024-06-02 to 2024-06-17
Can we measure water surface temperature?
No. The water bodies are removed from the signal because they may cause unrealistic Land Surface Temperature estimates. Water bodies influence the microwave observations and without proper mitigation they could result in unrealistic retrievals.