Land Surface Temperature
Sales for Planet’s 20m and 100m Land Surface Temperature products have been discontinued. Active contracts remain fully supported through their remaining terms, and the core infrastructure will officially sunset in November 2027. Upon renewal, please contact your Account Executive to transition to our 1km product variant or explore other suitable alternatives for your specific use case.
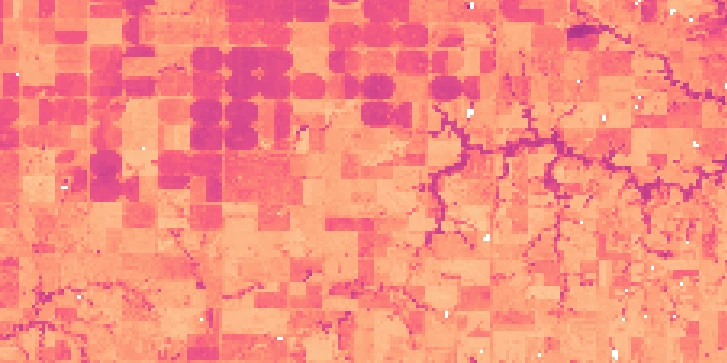
Accurate monitoring of Earth's surface temperature through satellite-derived information supports the understanding of many of our planet’s ecosystems, including physical processes that govern the three major cycles: carbon, energy and water.
Leveraging multiple earth observation datasets and innovative patented technology, Planet provides a twice-daily, global, consistent and accurate Land Surface Temperature products.
These datasets are not just numbers; It is a valuable tool for monitoring changes in cities, or understanding plant health and water availability. Also, this data plays a crucial role in assessing climate and meteorological risks by tracking temperature anomalies and shifts over time using the long archive capability.
What makes the Planet Land Surface Temperature (LST) product stand out is its unique blend of microwave and optical data, allowing the observation of temperature regardless of the cloud condition, so data can be compared consistently over time and space, providing the detailed insights needed for various applications.
Use Cases
Crop Stress Monitoring - Using LST as input in energy balanced-based evaporation models, crop stress can be detected early on and allows early intervention.
Phenology development - LST can be used as input for Growing Degree Days (check out the blog post). Growing degree days (GDD) is a weather-based indicator for assessing crop development. Crop producers use a measure of heat accumulation (temperature) to predict plant and pest development rates as the date for when a crop reaches maturity. The advantage of LST-based GDD lies in its ability to specifically monitor crop conditions, providing insights into the growth and development of crops, as opposed to relying solely on environmental conditions derived from air temperature.
Heatwave monitoring - Planet LST is able to monitor hot and dry conditions. The relationship between soil moisture and temperature indicates the severity and extent of drought conditions and the effect it has on crops, ecosystems, and the human population.
API Access Information
| API | Available | Notes |
|---|---|---|
| Data API | ❌ | |
| Orders API | ❌ | |
| Subscriptions API | ✅ | |
| Analytics API | ❌ | |
| Basemaps API | ❌ |
Subscriptions Access
Land Surface Temperature 20 m
The area of interest for LST 20 m should correspond to a single agricultural field. If the AOI of a subscription includes multiple fields, whether they contain different crops or the same crop managed differently, the resulting LST data will not accurately reflect conditions within any specific field. Similarly, if the AOI of a subscription includes non-agricultural areas, such as urban areas or water bodies, the resulting LST data will not accurately reflect conditions within the AOI.
Land Surface Temperature 100 m
Land Surface Temperature 1000 m
For more information on the Subscriptions API and code samples, see the API documentation.
Additional Resources
Learn the LST basics with this introduction course.
Read the latest LST news and stories.
Get started with the Subscriptions API.
Access LST and create visualizations with this tutorial.
Visualize LST and extract insights with EvalScripts.