Analytic Feeds Viewer
Planet Analytic Feeds use deep learning and computer vision to detect objects, identify geographic features, and monitor changes over time. The Analytic Feed Viewer visualizes these detections overlaid on source imagery.
Log into the Analytic Feeds Viewer to see available Analytic Feeds. Access to these products requires a subscription—contact your commercial representative or sales to learn more.
This guide covers the Viewer's core functionality. See the Analytics API documentation for detailed information on Analytic Feeds.
Available Analytic Subscriptions
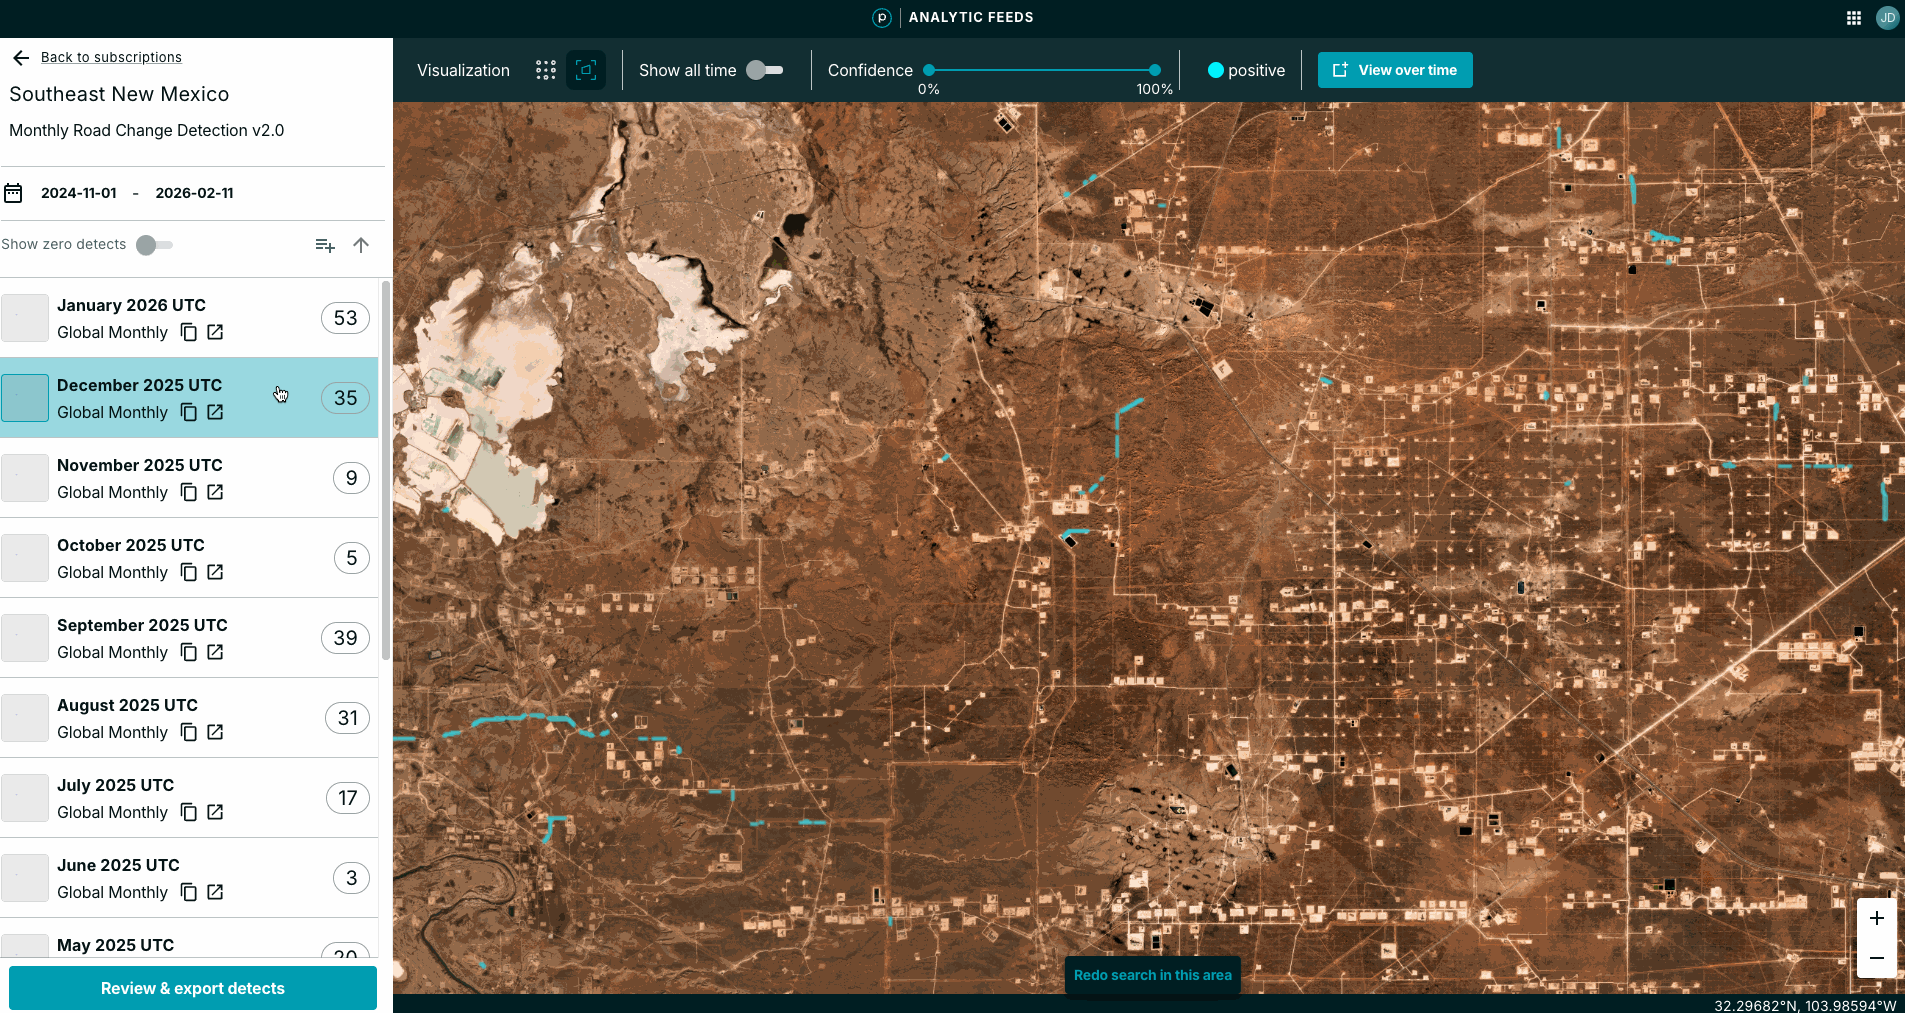
The Analytic Feeds Viewer displays all Analytic Subscriptions you can access. Each subscription represents analysis over a specific area and time period. For example: weekly Road Change Detection over Sweden from January 1, 2022, to January 1, 2024.
This list is empty if you have not purchased Planet Analytic Feeds.
Road Detection and Building Detection
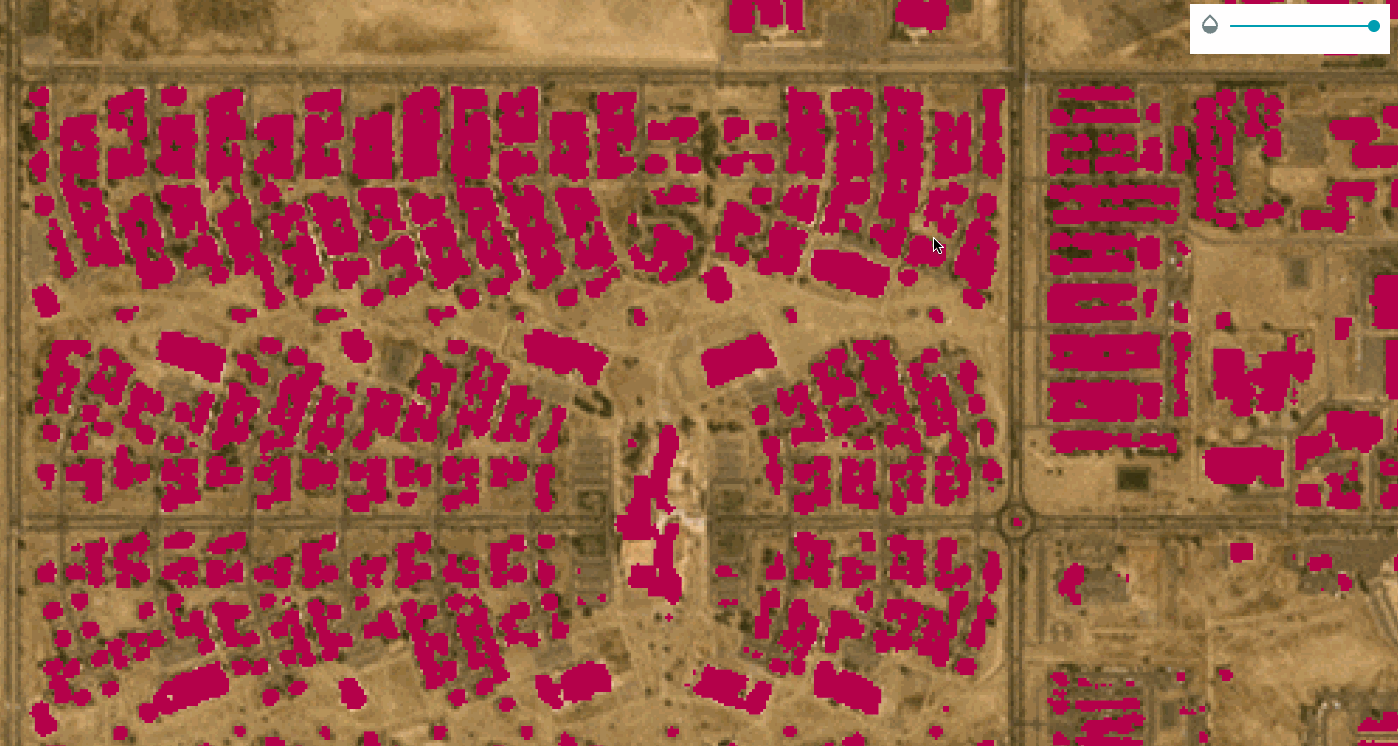
Road Detection and Building Detection produce segmentation layers that classify each pixel as road or building respectively. The Feed Viewer displays these raster GeoTIFF outputs overlaid on the visual mosaic of the same cadence (weekly or monthly).
Transparency Slider
Use the transparency slider at the top right to validate segmentation results against source imagery.
Road and Building Change Detection
Road and Building Change Detection identify newly constructed roads and buildings through temporal analysis. The Feed Viewer displays these vector polygon detections overlaid on the visual mosaic of the same cadence (weekly or monthly).
Heatmap Visualization

Detections display as individual polygons by default. Toggle to heatmap view (next to the Visualization label at the top left) for a zoomed-out view of detection locations.
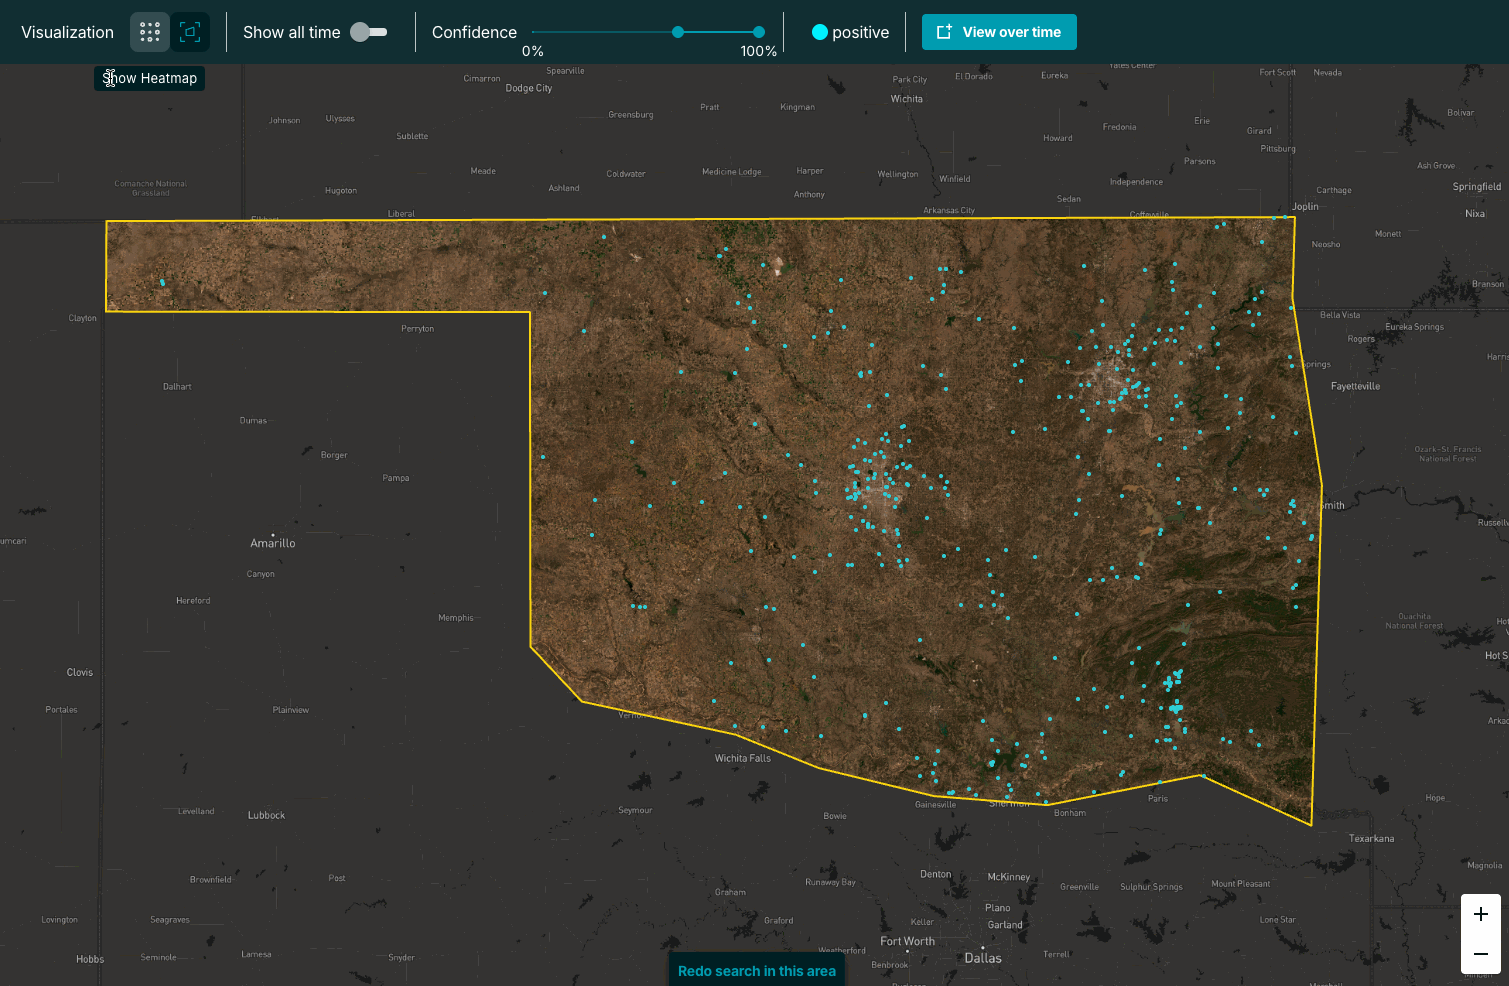
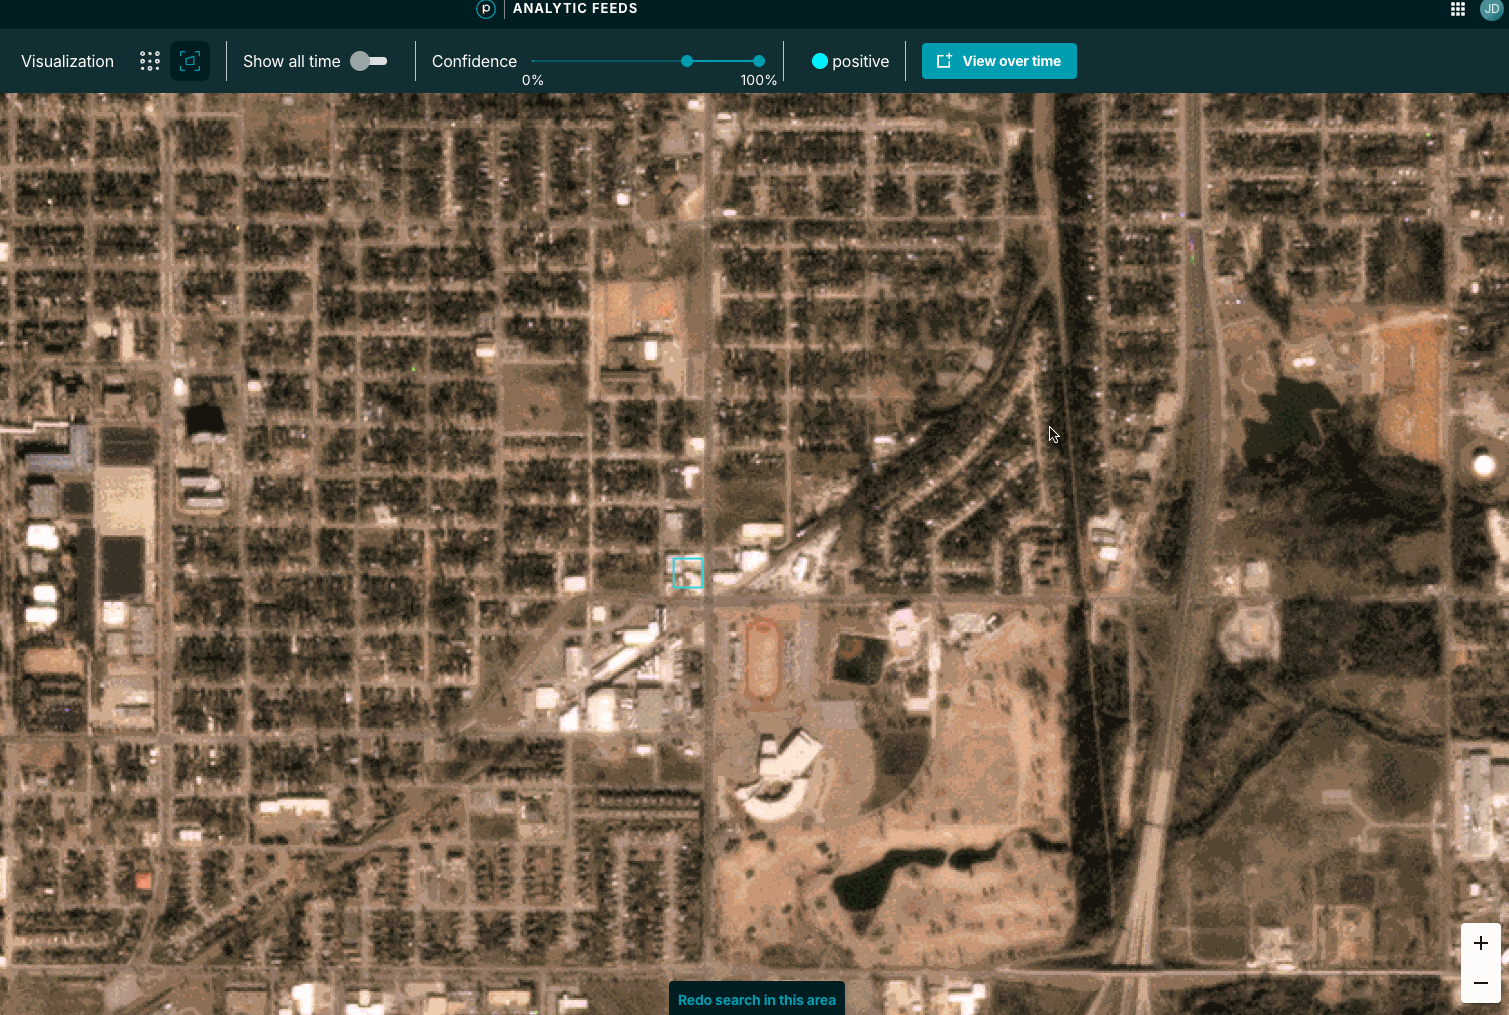
Confidence Score Filter
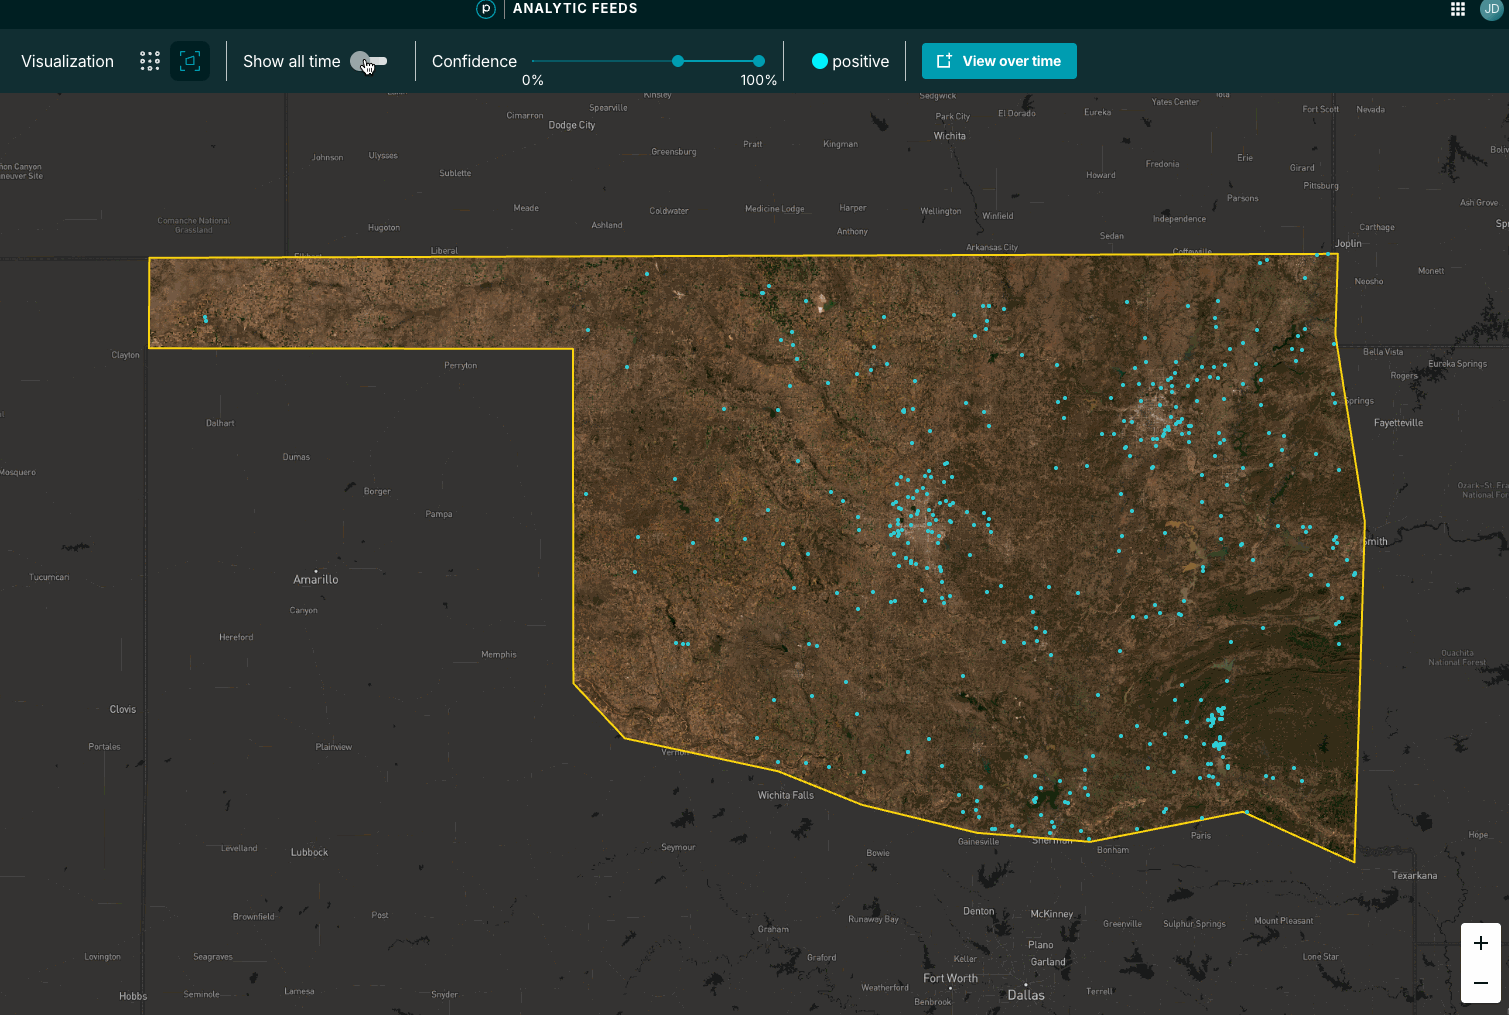
Each detection includes a confidence score indicating likelihood of a true positive. Increase the filter threshold to reduce false positives, though this may exclude some true positives with lower confidence scores.
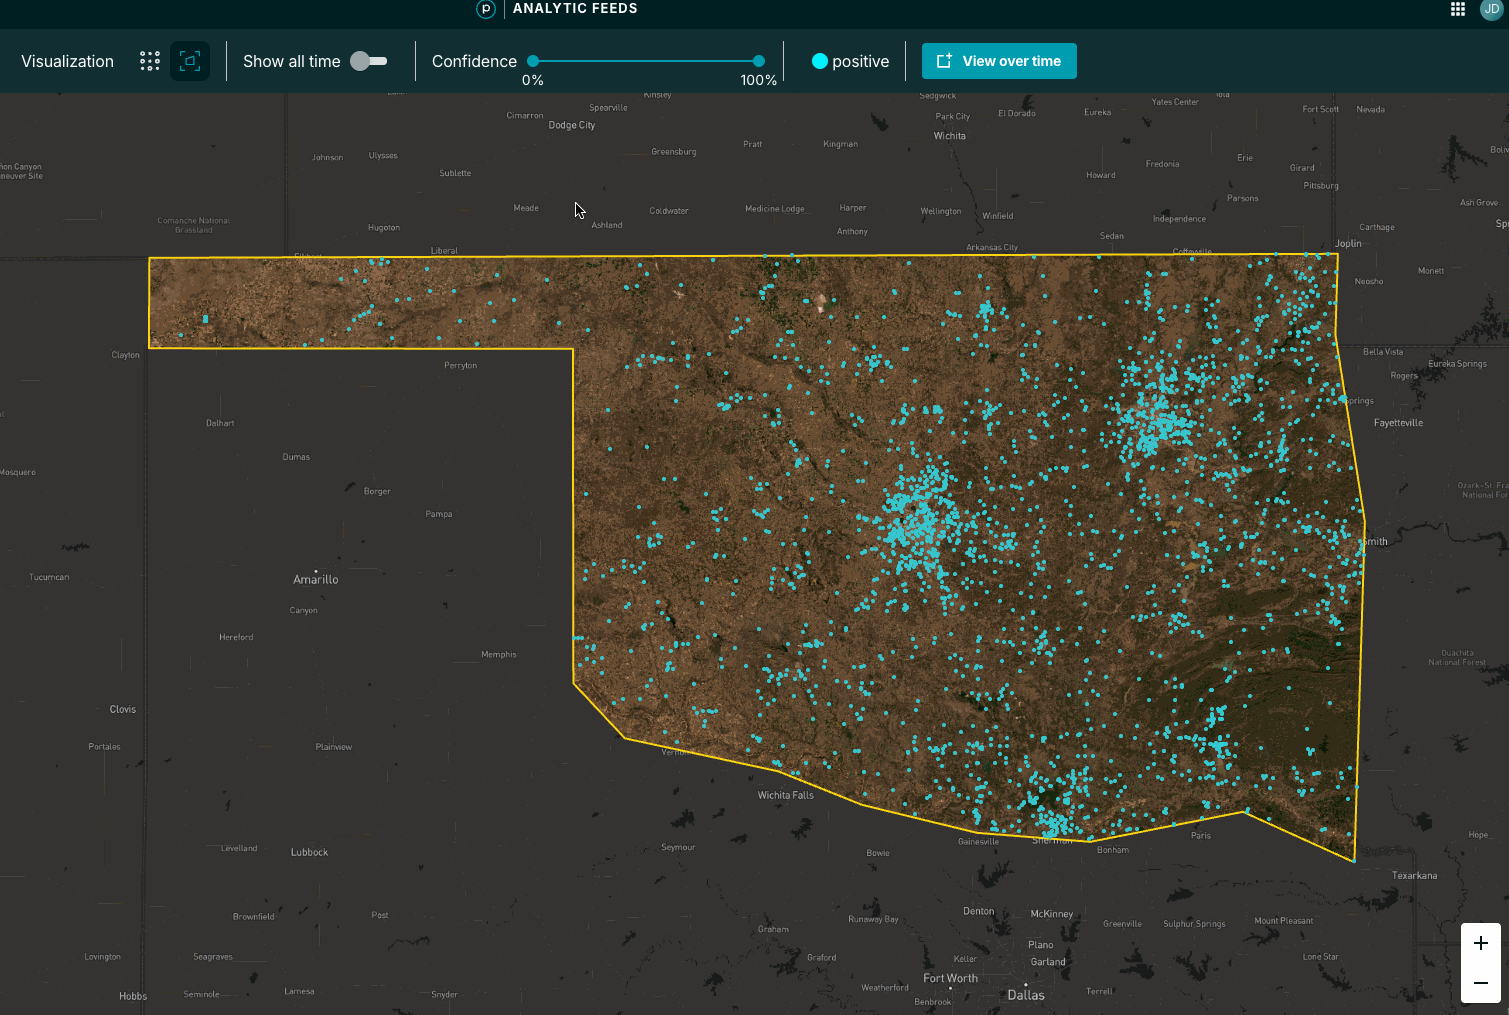
Show All Time
By default, the Viewer shows detections for a single time period (for example, one week for weekly subscriptions). Enable Show All Time to display all detections across the entire subscription time range.
View Over Time
The comparison mode shows time periods before and after detected changes. Access View over Time in the top toolbar.
Review & Export
The Review & Export workflow lets you validate each detection and generate a vetted GeoJSON feature collection containing only validated true positives. Click Review & Export at the bottom left to begin.
The workflow displays 6 time periods for each location. The bottom right frame shows when the change was detected; other frames show earlier time periods (oldest at top left). Click the frame where change first occurred to load the next detection. Click No Change to omit false positives from your export.
The left panel displays key metadata: confidence score, coordinates, and an option to task a high-resolution SkySat image.
Tasking requires access to the Tasking API.
Export options at the bottom left:
- Export Reviewed Detections - Export only validated detections
- Export All Detections - Export all detections regardless of review status
Click Exit at the top right to leave the workflow anytime.
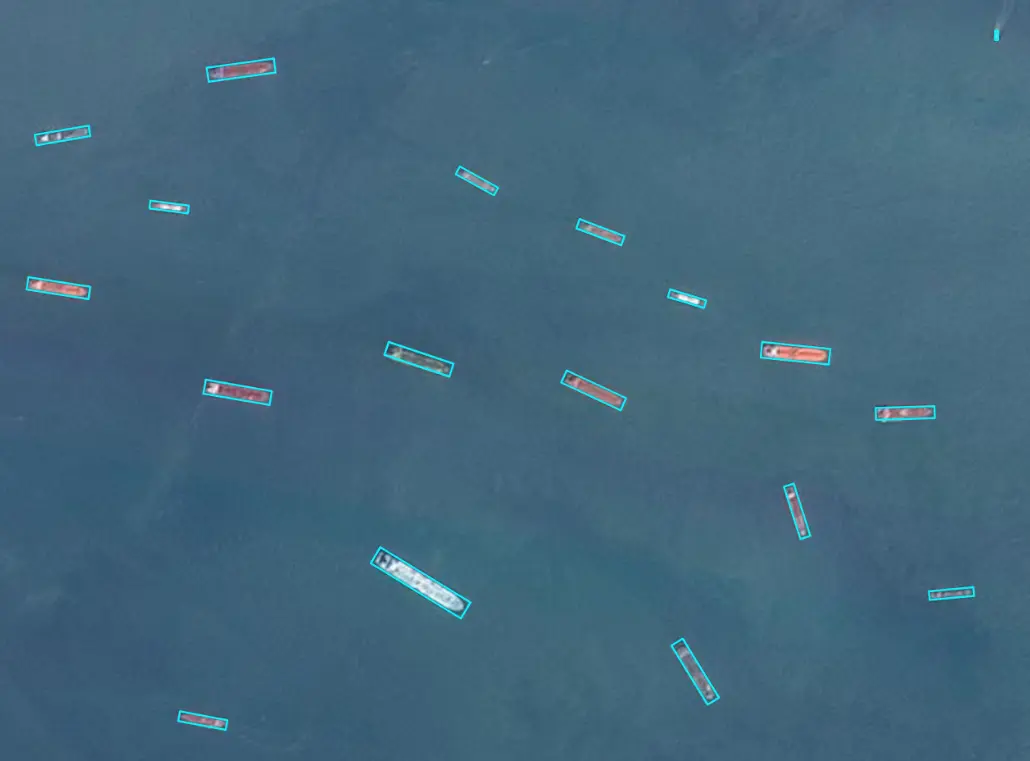
Vessel and Aircraft Detection
Vessel and Aircraft Detection identify individual objects in satellite imagery. The Viewer displays these vector polygon detections overlaid on source imagery.
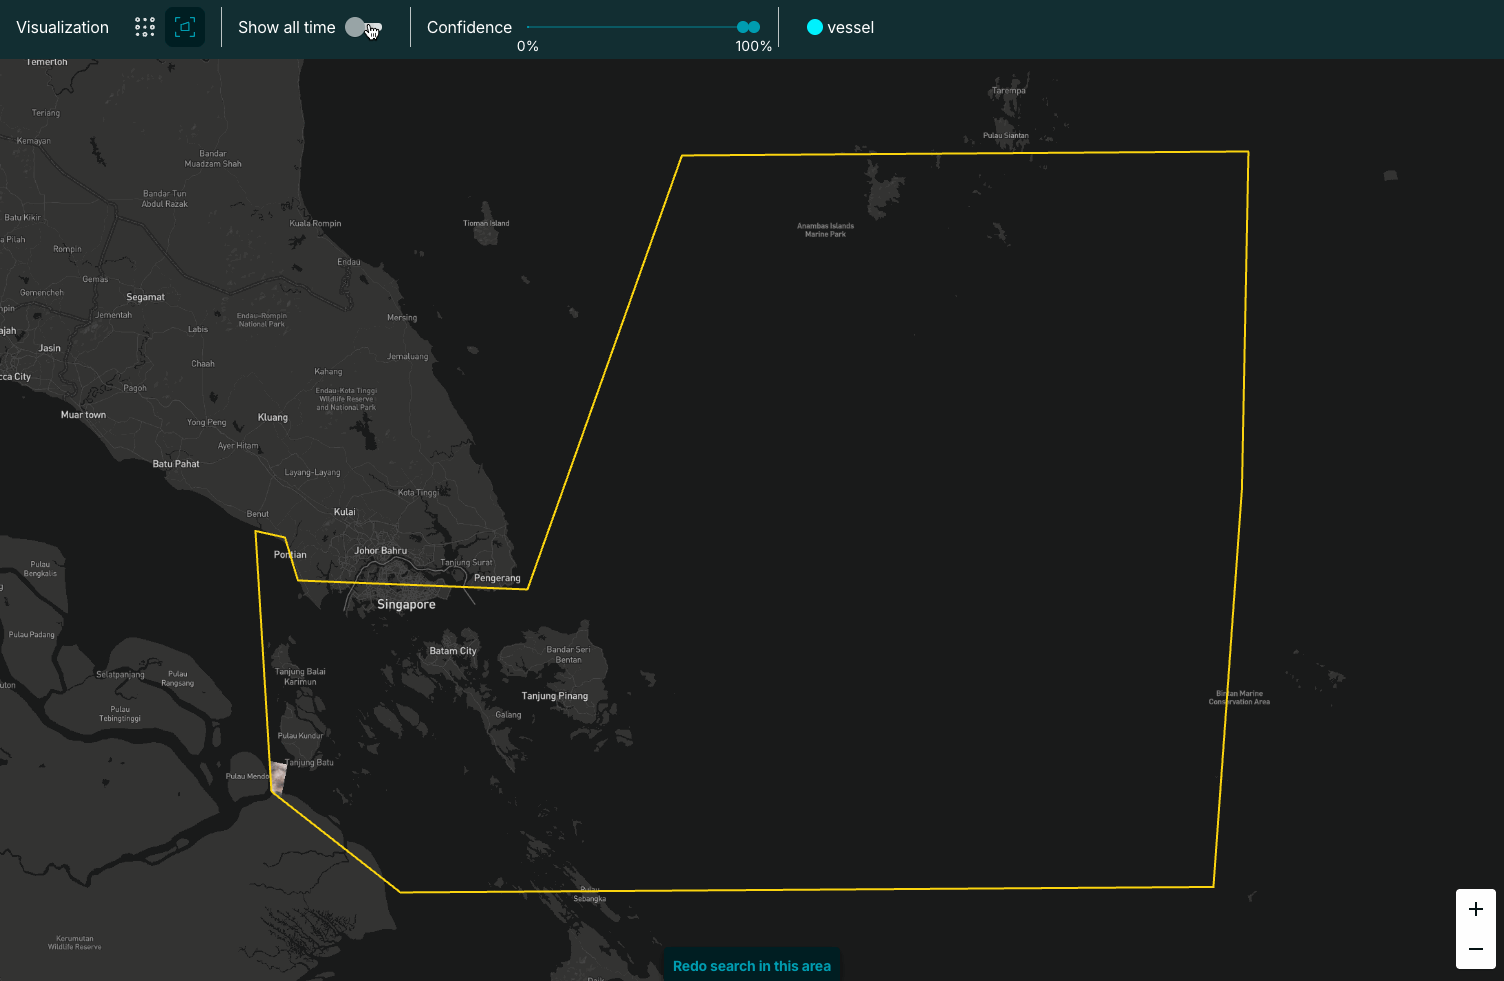
Show All Time
By default, the Viewer shows detections for a single scene. Enable Show All Time to display all detections across the entire subscription time range.
Heatmap Visualization
Detections display as individual polygons by default. Toggle to heatmap view (next to the Visualization label at the top left) for a zoomed-out view of detection locations.
Confidence Score Filter
Each detection includes a confidence score indicating likelihood of a true positive. Increase the filter threshold to reduce false positives, though this may exclude some true positives with lower confidence scores.