10m Annual Land Use Land Cover (9-class)
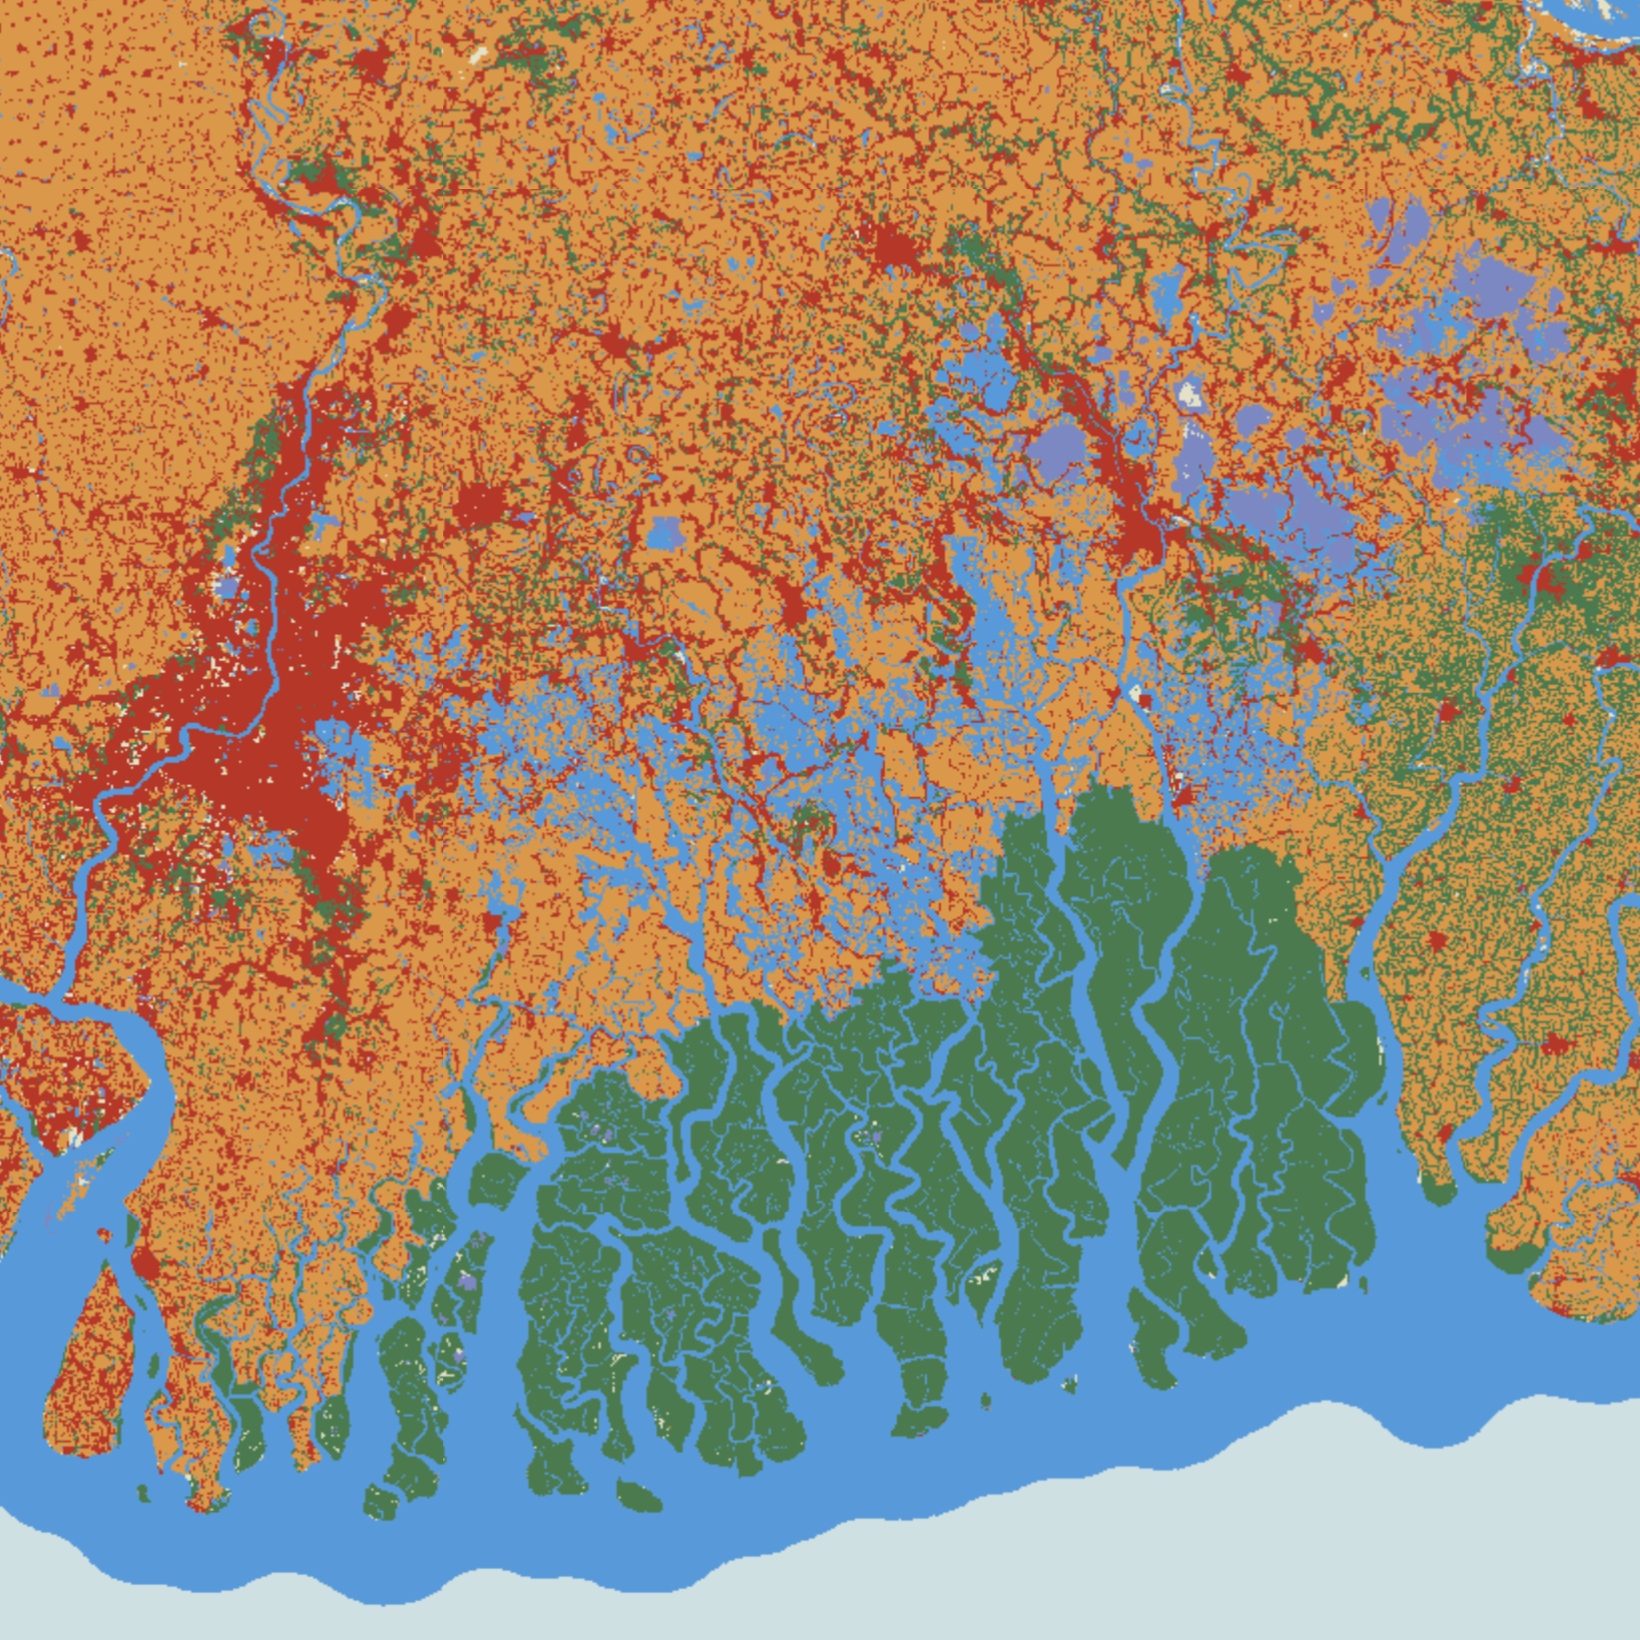
The 10m Annual Land Use Land Cover (9-class) dataset is a global map produced by Impact Observatory, Microsoft, and Esri. It provides a year-by-year snapshot of global land cover at a 10-meter resolution, derived from ESA Sentinel-2 imagery using a deep learning AI model.
This dataset is particularly valuable for monitoring urbanization, deforestation, and agricultural expansion over time.
Data Availability & Collections
The dataset is organized as a "Bring Your Own COG" (BYOC) collection within the Planet Insights Platform. Each pixel represents the most likely land cover class for the given year.
- Collection ID:
0ed26381-7344-4281-b180-66f3da521f75 - Update Frequency: The map is updated annually following the completion of the calendar year.
Basic Facts
| Property | Value |
|---|---|
| Sensor | MultiSpectral Instrument (MSI) from Sentinel-2 |
| Spatial Resolution | 10 m |
| Coordinate System | UTM (aligned to Sentinel-2 tiling grid) |
| Data Format | Cloud Optimized GeoTIFF (COG) |
| Temporal Coverage | 2017 – 2023 (Updated annually) |
| License | CC-BY 4.0 |
| Provider | Planet |
Class Definitions
The product consists of a single band named lulc. Each pixel contains an integer value from 1 to 11. Note that values 3 and 6 are not used in this 9-class schema.
| Value | Label | Color |
|---|---|---|
| 1 | Water | #419bdf |
| 2 | Trees | #397d49 |
| 4 | Flooded Vegetation | #7a87c6 |
| 5 | Crops | #e49635 |
| 7 | Built Area | #c4281b |
| 8 | Bare Ground | #a59b8f |
| 9 | Snow/Ice | #a8ebff |
| 10 | Clouds | #616161 |
| 11 | Rangeland | #e3e2c3 |
Accessing the Data
AWS S3 Access
The data is hosted in the AWS us-west-2 region. You can browse the directory structure using the AWS CLI:
aws s3 ls --no-sign-request s3://io-10m-annual-lulc/
Planet Insights Platform API
To access the data programmatically via the Planet Insights Platform:
-
Endpoint:
services.sentinel-hub.com -
Collection Type:
byoc-0ed26381-7344-4281-b180-66f3da521f75
Visualization Script (Evalscript)
To view the land cover map with the standard classification colors, use the following Evalscript in your request:
// VERSION=3
// Impact Observatory 10m LULC Visualizer
const colormap = [
  [1, 0x419bdf], // Water
  [2, 0x397d49], // Trees
  [4, 0x7a87c6], // Flooded Vegetation
  [5, 0xe49635], // Crops
  [7, 0xc4281b], // Built Area
  [8, 0xa59b8f], // Bare Ground
  [9, 0xa8ebff], // Snow/Ice
  [10, 0x616161], // Clouds
  [11, 0xe3e2c3], // Rangeland
];

const visualizer = new ColorMapVisualizer(colormap);

function setup() {
  return {
    input: ['lulc', 'dataMask'],
    output: { bands: 3 },
  };
}

function evaluatePixel(samples) {
  return visualizer.process(samples.lulc);
}
Attribution
This dataset is collaboratively produced by Impact Observatory, Microsoft, and Esri. It contains modified Copernicus Sentinel data processed by these partners.