CNES Land Cover Map
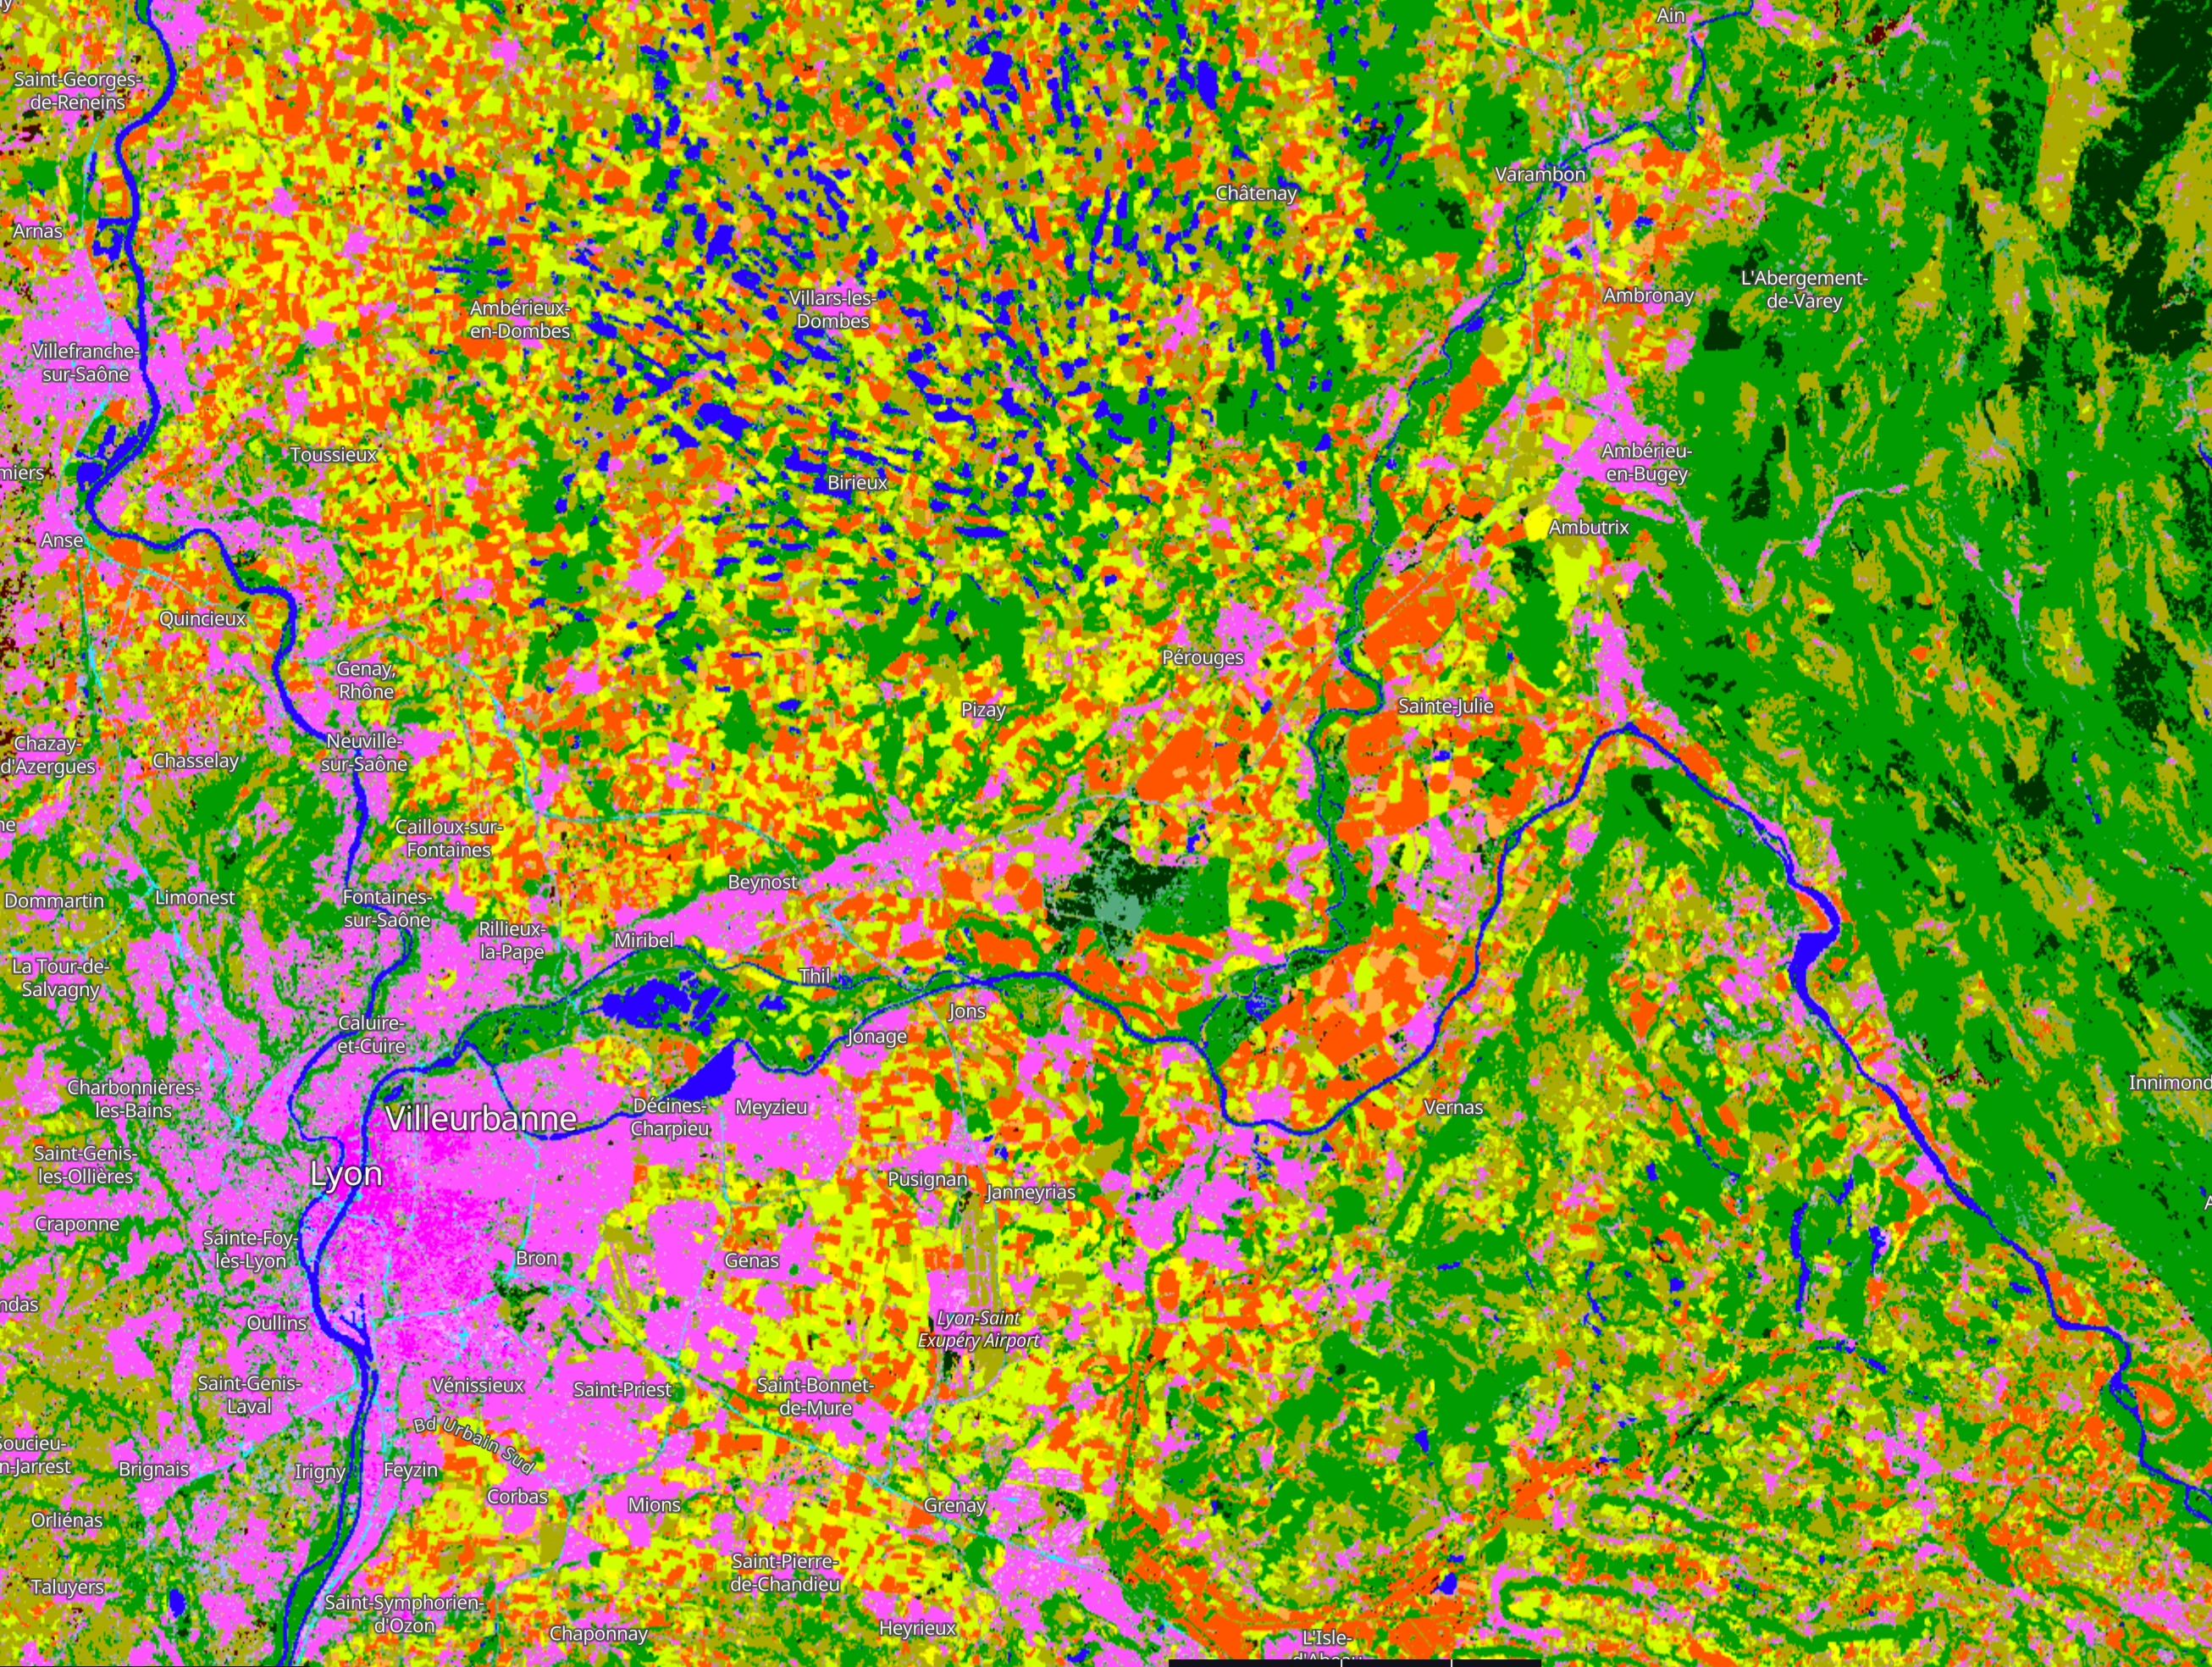
The CNES Land Cover Map (Occupation des Sols, OSO) produces land classification for Metropolitan France at a 10m spatial resolution. It is based on Sentinel-2 L2A data processed within the Theia Land Cover CES framework. The map is generated automatically using the iota² processing chain, which employs a Random Forest classifier calibrated with extensive national vector data (such as BD TOPO and Corine Land Cover).
Data Availability & Collections
The OSO maps are available as annual composites. Since 2018, the product has used a 23-category nomenclature, which is backward-compatible with the 17-category version used in 2016 and 2017.
-
Collection ID:
9baa2732-6597-49d2-ae3b-68ba0a5386b2 -
Update Frequency: Annually.
Basic Facts
| Property | Value |
|---|---|
| Sensor | MultiSpectral Instrument (MSI) from Sentinel-2 |
| Spatial Resolution | 10 m |
| Geographic Coverage | Metropolitan France |
| Coordinate System | Lambert-93 (EPSG:2154) or UTM |
| Data Format | Cloud Optimized GeoTIFF (COG) |
| Temporal Coverage | 2016 – 2022 (Updated annually) |
| License | ETALAB V2.0 Open License |
| Provider | Planet |
Band Information
The CNES Land Cover product contains three specific bands:
| Name | Description |
|---|---|
| OCS | Main discrete classification according to the 23-category nomenclature. |
| OCS_Confidence | Classifier confidence level (values 1 to 100). |
| OCS_Validity | Indicates the number of cloudless images used for the pixel classification. |
Class Definitions (23-Category Nomenclature)
The following table describes the classification values found in the OCS band for maps from 2018 onwards.
| Value | Label | Color |
|---|---|---|
| 1 | Dense built-up area | #ff00ff |
| 2 | Diffuse built-up area | #ff55ff |
| 3 | Industrial and commercial areas | #ffaaff |
| 4 | Roads | #00ffff |
| 5 | Oilseeds (Rapeseed) | #ffff00 |
| 6 | Straw cereals (Wheat, Triticale, Barley) | #d0ff00 |
| 7 | Protein crops (Beans / Peas) | #a1d600 |
| 8 | Soy | #ffab44 |
| 9 | Sunflower | #d6d600 |
| 10 | Corn | #ff5500 |
| 11 | Rice | #c5ffff |
| 12 | Tubers/roots | #aaaa61 |
| 13 | Grasslands | #aaaa00 |
| 14 | Orchards and fruit growing | #aaaaff |
| 15 | Vineyards | #550000 |
| 16 | Hardwood forest | #009c00 |
| 17 | Softwood forest | #003200 |
| 18 | Natural grasslands and pastures | #aaff00 |
| 19 | Woody moorlands | #55aa7f |
| 20 | Natural mineral surfaces | #ff0000 |
| 21 | Beaches and dunes | #ffb802 |
| 22 | Glaciers and eternal snows | #bebebe |
| 23 | Water | #0000ff |
Accessing the Data
Planet Insights Platform API
To access this collection programmatically, use the following details in your API requests:
-
Endpoint:
services.sentinel-hub.com -
Collection Type:
byoc-9baa2732-6597-49d2-ae3b-68ba0a5386b2
Visualization Script (Evalscript)
Use this script to visualize the land cover classification with the official CNES color scheme:
// VERSION=3
// CNES Land Cover (OSO) Visualizer
const colormap = [
  [1, 0xff00ff], [2, 0xff55ff], [3, 0ffaaff], [4, 0x00ffff],
  [5, 0xffff00], [6, 0xd0ff00], [7, 0xa1d600], [8, 0xffab44],
  [9, 0xd6d600], [10, 0xff5500], [11, 0xc5ffff], [12, 0 aaaa61],
  [13, 0 aaaa00], [14, 0 aaaaff], [15, 0x550000], [16, 0x009c00],
  [17, 0x003200], [18, 0 aaff00], [19, 0x55aa7f], [20, 0xff0000],
  [21, 0xffb802], [22, 0xbebebe], [23, 0x0000ff]
];

const visualizer = new ColorMapVisualizer(colormap);

function setup() {
  return {
    input: ["OCS", "dataMask"],
    output: { bands: 3 }
  };
}

function evaluatePixel(samples) {
  return visualizer.process(samples.OCS);
}
Attribution
Value-added data processed by CNES for the Theia data center from Copernicus data. Processing uses algorithms developed by Theia's Centers of Scientific Expertise.