Technical Specification
Key Product Features
With Planet Analytic Feeds for Road and Building Change Detection, you receive an end-to-end solution designed for immediate integration and analysis.
| Product | Cadence | Includes | Format | Delivery | Web Application |
|---|---|---|---|---|---|
| Road Detection | Weekly or Monthly | Visual Mosaic | Raster Geotiff | Analytics API, Basemaps API, Tile Services | Feed Viewer |
| Building Detection | Weekly or Monthly | Visual Mosaic | Raster Geotiff | Analytics API, Basemaps API, Tile Services | Feed Viewer |
| Road Change Detection | Weekly or Monthly | Visual Mosaic | Vector Geojson | Analytics API | Feed Viewer |
| Building Change Detection | Weekly or Monthly | Visual Mosaic | Vector Geojson | Analytics API | Feed Viewer |
Methodology
Planet’s Road & Building Change Detection takes a multiple step approach. At a high level, we run a semantic segmentation model on all the PlanetScope imagery published in a given area for a given week or month to assign a probability value (0-255) that the pixel represents a road, building or neither object.
The segmentation model results are aggregated together into a weekly or monthly layer and this process is repeated through time, generating a time-series of pixel values. Using the historical results, we run a predictive time series model to estimate what a given pixel’s value for a given time point should be compared to the actual observed value. When these values differ significantly, we create a change detection polygon indicating road or building development.
Segmentation Model
Planet’s Road & Building segmentation model is a modified UNET, a deep learning supervised segmentation model, that runs on 4-band (RGBNir) Surface Reflectance assets. It was trained on ~10 thousand Planetscope images paired with labels pulled from Microsoft’s open roads and buildings datasets to mark each pixel into one of 3 classes: Road, Building, or other.
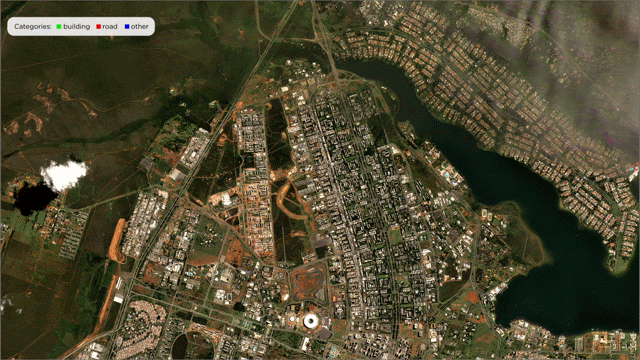
Planet's Road & Building segmentation model assigns a probability value (0-255) that a pixel represents a road, building, or neither object.
Planet leveraged 80% of the dataset to train the segmentation model, holding out 20% of the labeled dataset for validation to measure the model's performance. By comparing the model's results over this 20% holdout dataset, we are able to calculate the following precision, recall, and F1 measurements:
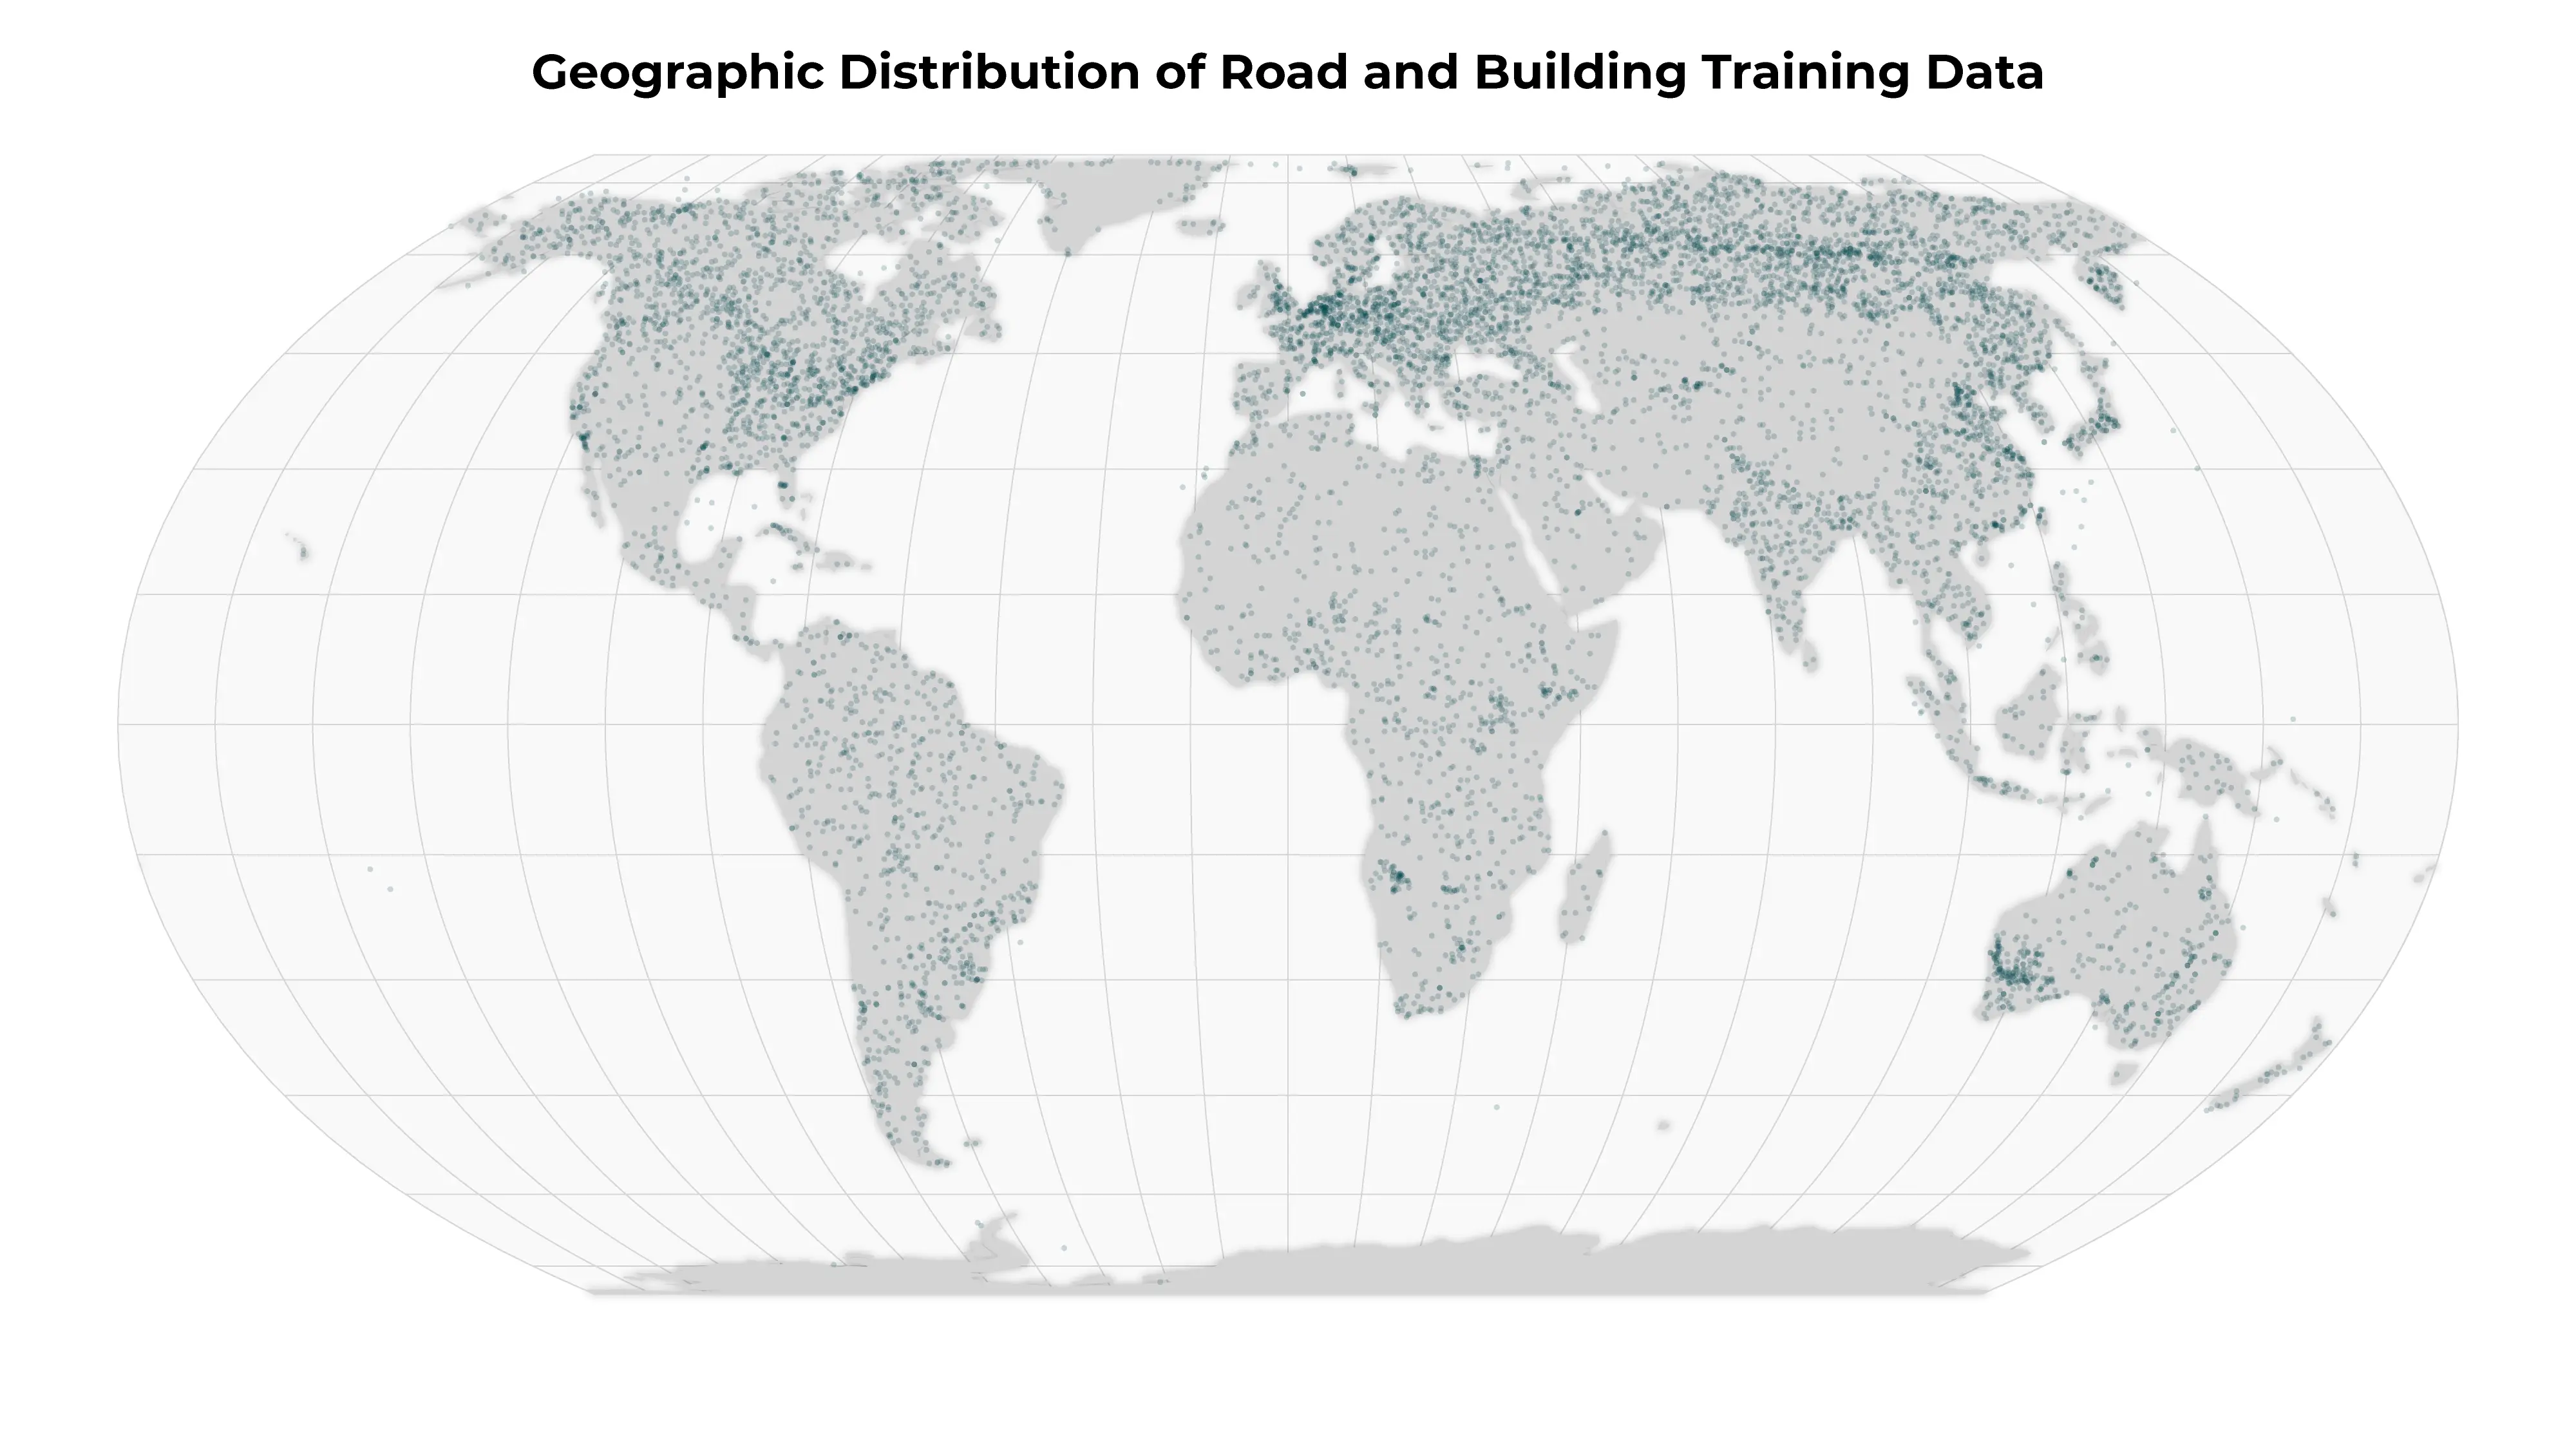
Global locations of the training data used to train the Road and Building detection segmentation model.
| Class | F1 | Precision | Recall |
|---|---|---|---|
| Road | 0.72 | 0.77 | 0.68 |
| Building | 0.81 | 0.81 | 0.81 |
| Background | 0.99 | 0.99 | 0.99 |
Result Aggregation
Planet publishes imagery just about everywhere, just about every day. While the model was trained and runs on individual images, we are able to generate even better results when we take advantage of the data density PlanetScope provides. For a given area, we run the segmentation model on all of the published PlanetScope data for a given week and then aggregate those results into a single weekly result. This process removes any noisy detections caused by atmospheric interference, provides the greatest coverage and generally ensures the best possible representation of roads and buildings for the location.
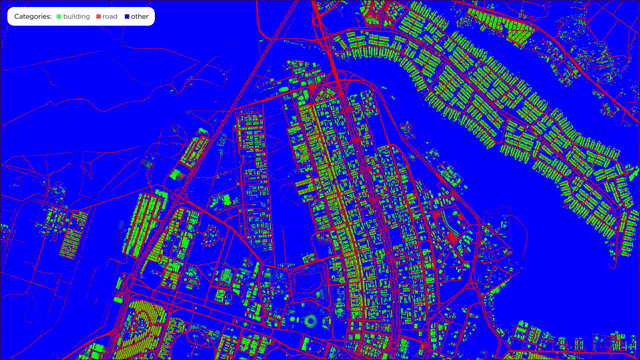
Daily results are aggregated into weekly or monthly layers, providing a consistent time series to analyze.
Change Detection
With the segmentation output aggregated to weekly results, we generate time series data that tracks a pixel’s segmentation value through time. Leveraging this information, we are able to run a predictive model that establishes an expectation of what the pixel value should be for any given time point. We then compare this predicted value to the observed value to calculate the number of standard deviations (or “z-score”) between what is expected and the observed value.
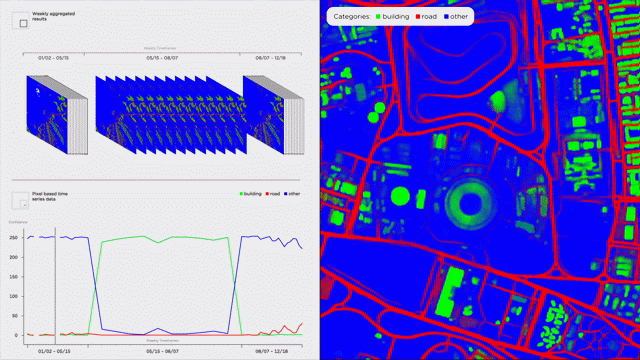
Time series data is analyzed to spot areas of development where pixel values have shifted significantly.
By evaluating this z-score through time, we found that z-scores greater than 10.5 indicated a high likelihood of real change taking place and results under this threshold were predominantly false positives. Because of this, we filter out any detections with a z-score under 10.5. We map the z-score to a “confidence score” between 0.5 and 1.0 that is surfaced in the metadata of the change detection. The higher the z-score, the closer the confidence score gets to 100%. Generally detections will have confidence scores between 50% and 75%.
Our change detection polygons are mapped to a standard 8x8 pixel gridcell, highlighting the area where the change took place.
Measuring the change detection model’s recall is difficult, since there is not a standard ground truth dataset that we can measure against. Any dataset we create would be powered by the change detection model itself, and it is hardly reasonable to measure it against itself. Still, we have been able to measure its precision. Manually validating hundreds of change events sampled across more than 100 regions, we found the model to have a precision of 0.94. While we have done our best to be exhaustive, we strongly suggest running a trial over your area to determine how well it performs to confirm it will work for your use case.
Delivery Mechanisms
Results are available via the Analytics API and Feed Viewer. For more details please see:
Full Metadata Reference
Feature-level Fields
| Property | Format | Example | Definition |
|---|---|---|---|
| created | ISO 8601 DateTime | "2026-02-03T19:02:45.270966Z" | The timestamp when the feature was created in the system |
| geometry | GeoJSON Geometry | {"type": "Polygon", "coordinates": [...]} | The geographic polygon defining the location of the detected change |
| id | UUID | "17f21835-93c4-4664-b2ef-c2f57f5809a5" | The unique identifier for the feature |
| links | Array of Link Objects | [{"href": "...", "rel": "self", "type": "..."}] | Array of related resources including visual tiles, quads, process info, and observation data |
| type | String | "Feature" | The GeoJSON feature type |
Properties
| Property | Format | Example | Definition |
|---|---|---|---|
| change_direction | String | "positive" | The direction of change detected (positive indicates new development) |
| class_label | String | "road" | The classification label for the type of infrastructure detected (road or building) |
| date | ISO 8601 DateTime | "2026-02-02T00:00:00Z" | The end date of the observation period when the change was detected |
| model_version | String | "production" | The version of the model used for detection |
| object_area_m2 | Float | 461.042850935856 | The area of the detected change in square meters |
| object_class_label | String | "positive" | The classification label indicating the type of change |
| observed | ISO 8601 DateTime | "2026-01-26T00:00:00Z" | The start date of the observation period |
| score | Float | 0.5937995365687779 | The model's confidence in the detection accuracy (0.5-1.0 scale, where higher values indicate greater certainty) |
| source_mosaic_name | String | "rnb_weekly_v2_2026_01_26_2026_02_02" | The name of the source mosaic used for detection |
| source_quad_id | String | "1140-1295" | The identifier of the source quad tile |
| visual_mosaic_name | String | "ps_weekly_visual_subscription_2026-01-26_2026-02-02_mosaic" | The name of the visual mosaic for imagery display |
| visual_quad_id | String | "1140-1295" | The identifier of the visual quad tile |
With Planet Road & Building Change Detection, you gain a robust, persistent, and reliable view of development over the areas you care most about.