Examples
On this page, there are example evalscripts that will help with understanding the basics of writing evalscripts. There are additional examples for getting started on the custom scripts repository.
All the scripts utilize the Sentinel-2 L2A and Analysis Ready PlanetScope data collections. For more examples, follow the Introduction to Custom Scripts on Planet Insights Platform course on Planet University.
Returning a True Color Image
- Code Version 3 must be specified in the custom script header using
//VERSION=3. - The
setup()is a mandatory function used to specify the input bands used, the output shape, and the format of your response. In this example, there are three bands in the input; the return also contains three bands. - The
evaluatePixel()is a mandatory function that performs the required operations per pixel. - Note that the returned object's shape (3 elements) matches the specified shape in the output defined in the
setup()function.
- Sentinel-2 L2A
- Analysis Ready PlanetScope
//VERSION=3

function setup() {
  return {
    input: ['B02', 'B03', 'B04'],
    output: {
      bands: 3,
      sampleType: 'AUTO',
    },
  };
}

function evaluatePixel(sample) {
  return [sample.B04, sample.B03, sample.B02];
}
//VERSION=3

function setup() {
  return {
    input: ['blue', 'green', 'red'],
    output: {
      bands: 3,
      sampleType: 'AUTO',
    },
  };
}

let factor = 1 / 2000;

function evaluatePixel(sample) {
  return [factor * sample.red, factor * sample.green, factor * sample.blue];
}
The output of the above script results in the following image:
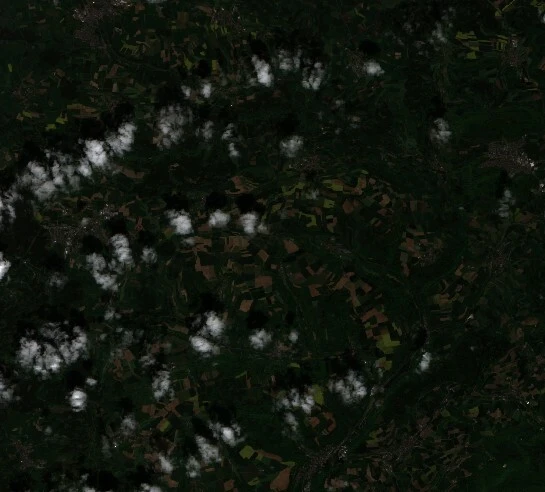
True Color with Color Correction
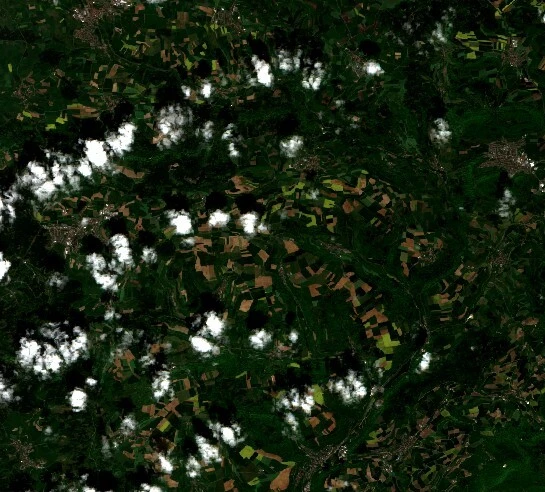
Basic color correction can be performed in the return function, like in the example below, which brightens and increases the contrast of the image returned.
- Sentinel-2 L2A
- Analysis Ready PlanetScope
return [
  2.5 * sample.B04 - 0.07,
  2.5 * sample.B03 - 0.07,
  2.5 * sample.B02 - 0.07,
];
return [
  2.5 * sample.red - 0.07,
  2.5 * sample.green - 0.07,
  2.5 * sample.blue - 0.07,
];
Output:
Calculating Raw NDVI Values
Spectral indices can be generated within an evalscript.
- Note that this script only uses the two bands required to calculate NDVI in its input.
- In addition, the index is only a 1-band image, so the output is defined as one band.
- Note that the
sampleTypein the output definition has changed fromAUTOtoFLOAT32, meaning the output can contain float values (decimals). - Within the
evaluatePixel()function theindex()function is applied to these 2 bands to return NDVI values.
- Sentinel-2 L2A
- Analysis Ready PlanetScope
//VERSION=3
function setup() {
  return {
    input: ['B04', 'B08'],
    output: {
      bands: 1,
      sampleType: 'FLOAT32',
    },
  };
}

function evaluatePixel(samples) {
  return [index(samples.B08, samples.B04)];
}
//VERSION=3
function setup() {
  return {
    input: ['red', 'nir'],
    output: {
      bands: 1,
      sampleType: 'FLOAT32',
    },
  };
}

function evaluatePixel(samples) {
  return [index(samples.nir, samples.red)];
}
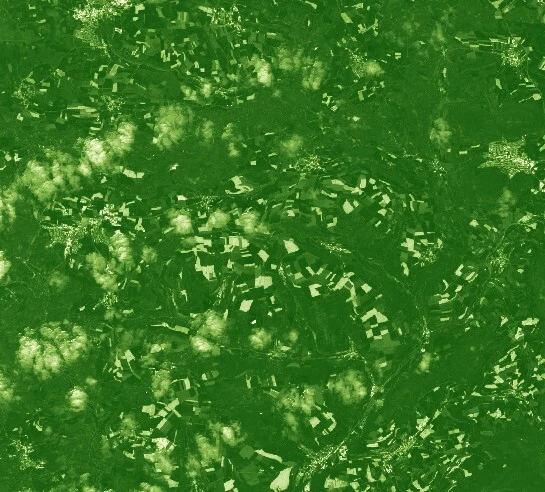
Calculating NDVI and Returning an Interpolated Colormap
To visualize output, calculate the spectral index and return interpolated colormaps instead of the raw NDVI values.
- Compared to the previous example, the output is now three bands rather than 1.
- The index function is now defined as a variable using
let NDVI. - The return is now defined by the
valueInterpolate()function. This requires three inputs: the input values (in this case, NDVI), the intervals, an array of numbers in ascending order defining intervals, and the output interval for the given value/interval of the intervals array. - In this example, five intervals and five arrays are defined with the RGB values to create the colormap.
- Sentinel-2 L2A
- Analysis Ready PlanetScope
//VERSION=3
function setup() {
  return {
    input: ['B04', 'B08'],
    output: {
      bands: 3,
      sampleType: 'FLOAT32',
    },
  };
}

function evaluatePixel(samples) {
  let NDVI = index(samples.B08, samples.B04);
  return valueInterpolate(
    NDVI,
    [-1, 0, 0.2, 0.5, 1],
    [
      [0, 0, 0],
      [1, 1, 0.88],
      [0.57, 0.75, 0.32],
      [0.31, 0.54, 0.18],
      [0.06, 0.33, 0.04],
    ],
  );
}
//VERSION=3
function setup() {
  return {
    input: ['red', 'nir'],
    output: {
      bands: 3,
      sampleType: 'FLOAT32',
    },
  };
}

function evaluatePixel(samples) {
  let NDVI = index(samples.nir, samples.red);
  return valueInterpolate(
    NDVI,
    [-1, 0, 0.2, 0.5, 1],
    [
      [0, 0, 0],
      [1, 1, 0.88],
      [0.57, 0.75, 0.32],
      [0.31, 0.54, 0.18],
      [0.06, 0.33, 0.04],
    ],
  );
}
Output:
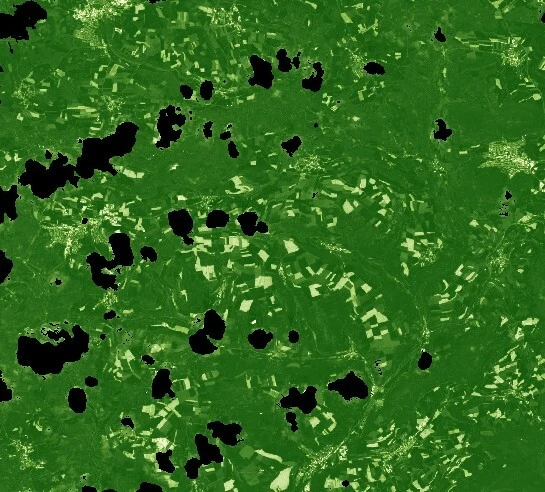
Masking Out Cloudy Pixels
Data masks may be used, for example, to exclude cloudy pixels from visualizations.
- If visualizing Sentinel-2 L2A data, use the
SCLband to perform the masking. - In the following example, if the
SCLband has one of the following values: 8, 9, or 10, those pixels will be black. - Alternatively, if visualizing Analysis Ready Planetscope, utilize the
cloudmaskband.
- Sentinel-2 L2A
- Analysis Ready PlanetScope
//VERSION=3

function setup() {
  return {
    input: ['B04', 'B08', 'SCL'],
    output: {
      bands: 3,
      sampleType: 'AUTO',
    },
  };
}

function evaluatePixel(samples) {
  let NDVI = index(samples.B08, samples.B04);
  if ([8, 9, 10].includes(samples.SCL)) {
    return [0, 0, 0];
  } else {
    return valueInterpolate(
      NDVI,
      [-1, 0, 0.2, 0.5, 1],
      [
        [0, 0, 0],
        [1, 1, 0.88],
        [0.57, 0.75, 0.32],
        [0.31, 0.54, 0.18],
        [0.06, 0.33, 0.04],
      ],
    );
  }
}
//VERSION=3

function setup() {
  return {
    input: ['red', 'nir', 'cloud_mask'],
    output: {
      bands: 3,
      sampleType: 'AUTO',
    },
  };
}

function evaluatePixel(samples) {
  let NDVI = index(samples.nir, samples.red);
  if (samples.cloud_mask > 1) {
    return [0, 0, 0];
  } else {
    return valueInterpolate(
      NDVI,
      [-1, 0, 0.2, 0.5, 1],
      [
        [0, 0, 0],
        [1, 1, 0.88],
        [0.57, 0.75, 0.32],
        [0.31, 0.54, 0.18],
        [0.06, 0.33, 0.04],
      ],
    );
  }
}
Output:
Calculating the Mean NDVI Value During a Given Time Period
Multi-temporal analysis can also be performed and will output aggregated products using evalscripts. This example explains how to calculate the mean NDVI value over a given time period.
- By default, evalscripts use
SIMPLEmosaicking, meaning only one satellite scene will be used. Note that mosaicking is explicitly set toORBITin this example so that you can use multiple scenes. - The calculation of NDVI is defined within a function named
calcNDVI(). - The evalscript then loops through the scenes in the evalscript, performing this function on each of the scenes.
- Lastly, the mean is calculated using the sum (number of scenes) and the cumulative count of NDVI values across those scenes.
- Sentinel-2 L2A
- Analysis Ready PlanetScope
//VERSION=3
function setup() {
  return {
    input: [{ bands: ['B04', 'B08', 'dataMask'] }],
    output: {
      bands: 1,
    },
    mosaicking: 'ORBIT',
  };
}

function calcNDVI(sample) {
  var NDVI = (sample.B08 - sample.B04) / (sample.B08 + sample.B04);
  return NDVI;
}

function evaluatePixel(samples) {
  var sum = 0;
  var count = 0;
  for (var i = 0; i < samples.length; i++) {
    if (samples[i].dataMask != 0) {
      var ndvi = calcNDVI(samples[i]);
      sum = sum + ndvi;
      count++;
    }
  }
  var average = sum / count;

  return [average];
}
//VERSION=3
function setup() {
  return {
    input: [{ bands: ['red', 'nir', 'dataMask'] }],
    output: {
      bands: 1,
    },
    mosaicking: 'ORBIT',
  };
}

function calcNDVI(sample) {
  var NDVI = (sample.nir - sample.red) / (sample.nir + sample.red);
  return NDVI;
}

function evaluatePixel(samples) {
  var sum = 0;
  var count = 0;
  for (var i = 0; i < samples.length; i++) {
    if (samples[i].dataMask != 0) {
      var ndvi = calcNDVI(samples[i]);
      sum = sum + ndvi;
      count++;
    }
  }
  var average = sum / count;

  return [average];
}
Comparing Two Dates to Perform Change Detection
A common task is to compare imagery from two dates — for example, to compute the change in NDVI between a "before" and an "after" acquisition. The recommended way to do this is with data fusion: request the same data collection twice, each with its own time range, and give each input an id (here before and after). This has two advantages:
- The dates live in the request, not in the evalscript. You can run the same registered evalscript for any pair of dates by changing only the request body — no code edit or re-upload.
- It avoids extra input processing. Each input is filtered to a single date by its
timeRange, so only the two scenes you need are read, rather than loading the full stack and discarding scenes in the script.
In the evalscript, the two inputs are accessed by their id as keys of the samples object. With SIMPLE mosaicking each key is an array holding a single mosaic, so the date's data is samples.before[0] and samples.after[0].
- Sentinel-2 L2A
- Analysis Ready PlanetScope
//VERSION=3
function setup() {
  return {
    input: [
      { datasource: 'before', bands: ['B04', 'B08', 'dataMask'] },
      { datasource: 'after', bands: ['B04', 'B08', 'dataMask'] },
    ],
    output: { bands: 1, sampleType: 'FLOAT32' },
    mosaicking: 'SIMPLE',
  };
}

function calcNDVI(sample) {
  return (sample.B08 - sample.B04) / (sample.B08 + sample.B04);
}

function evaluatePixel(samples) {
  var before = samples.before[0];
  var after = samples.after[0];
  if (before.dataMask === 0 || after.dataMask === 0) {
    return [NaN];
  }
  return [calcNDVI(after) - calcNDVI(before)];
}
//VERSION=3
function setup() {
  return {
    input: [
      { datasource: 'before', bands: ['red', 'nir', 'dataMask'] },
      { datasource: 'after', bands: ['red', 'nir', 'dataMask'] },
    ],
    output: { bands: 1, sampleType: 'FLOAT32' },
    mosaicking: 'SIMPLE',
  };
}

function calcNDVI(sample) {
  return (sample.nir - sample.red) / (sample.nir + sample.red);
}

function evaluatePixel(samples) {
  var before = samples.before[0];
  var after = samples.after[0];
  if (before.dataMask === 0 || after.dataMask === 0) {
    return [NaN];
  }
  return [calcNDVI(after) - calcNDVI(before)];
}
The request body declares the two inputs and matches each id to a datasource in the evalscript. The example below uses the Analysis-Ready PlanetScope Sandbox Data collection over a cropland area in Iowa, comparing bare soil in spring to peak crop growth in summer.
{
  "input": {
    "bounds": {
      "bbox": [-93.84, 41.16, -93.78, 41.22],
      "properties": {
        "crs": "http://www.opengis.net/def/crs/EPSG/0/4326"
      }
    },
    "data": [
      {
        "type": "byoc-3f605f75-86c4-411a-b4ae-01c896f0e54e",
        "id": "before",
        "dataFilter": {
          "timeRange": {
            "from": "2022-04-26T00:00:00Z",
            "to": "2022-04-26T23:59:59Z"
          }
        }
      },
      {
        "type": "byoc-3f605f75-86c4-411a-b4ae-01c896f0e54e",
        "id": "after",
        "dataFilter": {
          "timeRange": {
            "from": "2022-08-05T00:00:00Z",
            "to": "2022-08-05T23:59:59Z"
          }
        }
      }
    ]
  },
  "output": {
    "width": 512,
    "height": 512,
    "responses": [
      { "identifier": "default", "format": { "type": "image/tiff" } }
    ]
  }
}
To compare two dates of the same data collection, set the same collection type for both inputs and only change the timeRange, as shown above. To compare across different collections (for example, Sentinel-2 against Landsat), give each input its own type.
Additional Resources
Explore a collection of custom scripts for Sentinel Hub.
Explore the video tutorial that explains what custom scripts are, and how to create them.
Check out the Jupyter notebooks tutorial on GitHub for using evalscripts.