Similarity and Euclidian Distance Marker
Basic info
Similarity and Euclidean distance markers belong to the group of crop classification markers. Output of both markers can be used to check validity of a FOI's claim. In their essence both markers compare signal time series of a FOI to signal time series of neighboring FOIs. The way the comparison is made is different between the two markers and will be described below. Similarity and Euclidean distance markers perform statistical comparison and do not require any model training, which is their biggest advantage.
FOI's neighborhood
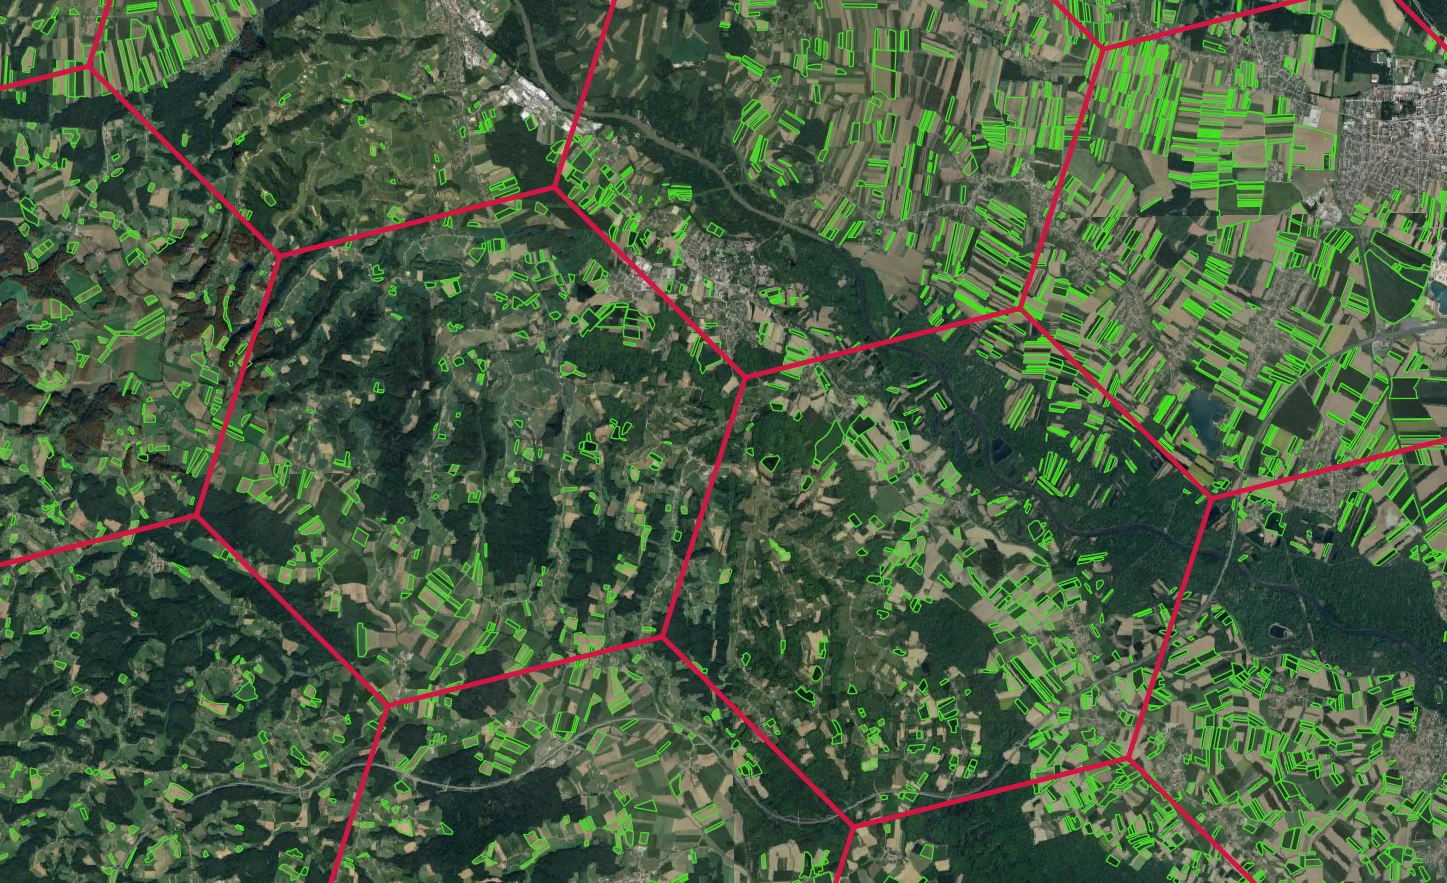
Both markers compare a FOI's signal time series to other FOIs in its neighborhood. Area of interest (for example, Slovenia in this demo) is divided into smaller hexagons as shown in the Figure below. Each FOI is assigned to exactly one such hexagon based on location of FOI's centroid. Distance between the opposite edges of a hexagon is 7.7 kilometers. Neighboring FOIs are pooled among FOIs that are located within the same hexagon, or the same hexagon plus a ring of 6 neighboring hexagons, depending on marker configuration.
Further info
Similarity score
Similarity marker evaluates how similar a FOI is to other FOIs from its neighborhood having the same (or different) claim based on time series of a signal. Typically we use Normalized Difference Vegetation Index (NDVI) for easier interpretation. For example, how similar is a cornfield to other cornfields in its vicinity? Similarity is calculated by comparing a FOI's NDVI time series to an average NDVI time series of FOIs from its vicinity having the same (or different) claim. Comparison is therefore between a FOI and average of many other FOIs that are located near this FOI.
The process of calculating the similarity score for this "target" FOI is the following (we use winter wheat as an example):
-
Identify up to 100 (configurable) FOIs within the neighborhood of the target FOI that claim to cultivate the same crop.
-
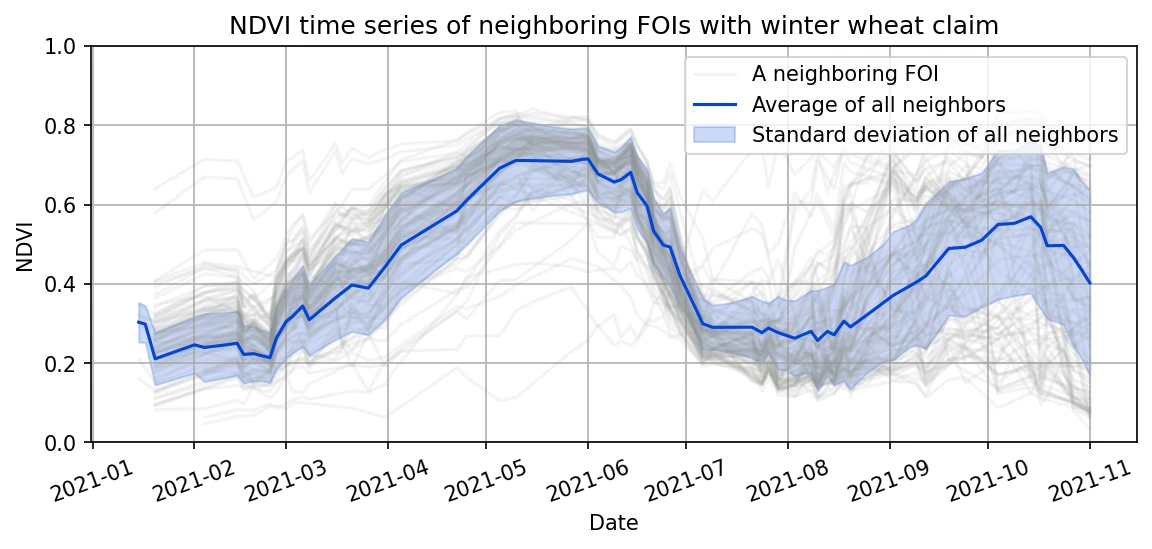
Calculate average and standard deviation of the NDVI time series of the identified neighboring FOIs. This average and standard deviation are used as a reference NDVI time series in the calculation of the similarity score. They illustrate how the NDVI of winter wheat should evolve over the season.
- Calculate similarity score for crop , which is defined as:
where the sum runs over all valid observations of a FOI with index , represents the NDVI value of FOI on date , and and represent the average and standard deviation of NDVI over neighboring FOIs with claimed crop on date . represents the number of all valid observations.
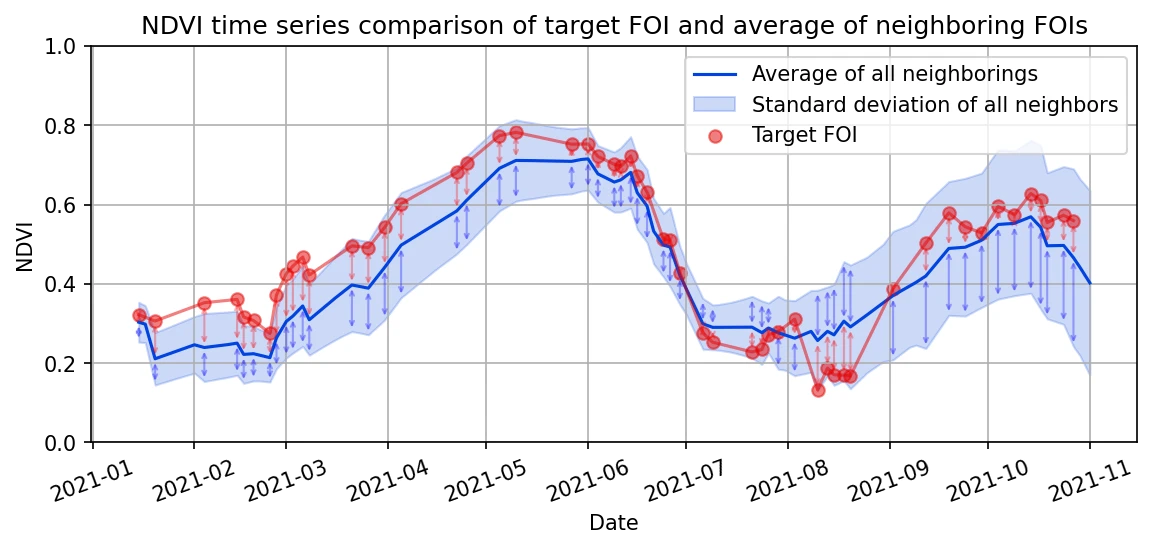
Figure below shows the comparison of NDVI time series of a FOI claimed to grow winter wheat and an average of 100 neighboring FOIs with the same claim. Numerator in the above equation, , is shown in the figure with red arrows and the denominator, , is shown with blue arrows. The figure nicely illustrates that the shorter the red arrows are, the more similar the FOI is to its neighboring FOIs with a given claimed crop.
We often refer to crop as hypothesis. For every FOI we can calculate as many similarity scores as there are different crop types - hypotheses. By doing this we can not only answer questions like "Is signal of a FOI similar to signals of other FOIs with the same claim?", but also "What is the crop type of FOIs to which signal of a FOI is most similar to?".
Values of the similarity score, , are difficult to interpret. To make the interpretation easier we transform the scores in a such a way that a similarity score distribution for crop of all FOIs with a claim to grow crop is a flat distribution between 0 and 100. In other words, we transform the value of each score to a corresponding percentile.
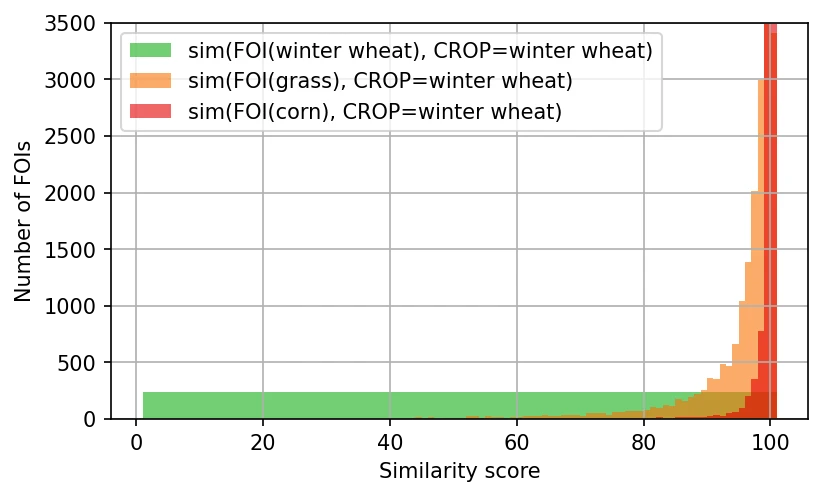
Figure below shows the transformed similarity score distributions for winter wheat hypothesis for FOIs claiming to grow:
- winter wheat, ,
- grass, ,
- and corn, ,
As it can be seen the distribution of is a flat distribution, but , and peak towards 100. These distributions show, that if a FOI claims to grow winter wheat, but in reality is growing corn, then its similarity score for winter wheat hypothesis will be high, close to 100. On the other hand if a FOI claims to grow winter wheat, but in reality it grows grass, then its similarity score for winter wheat hypothesis will be high, but not as high as in the case of corn. The reason is that NDVI time-series of FOIs growing grass are in average more similar to FOIs growing winter wheat than FOIs growing corn.
Euclidean distance
Euclidean distance or distance marker evaluates how near in Euclidean distance metric space a FOI is to other nearby FOIs. The distance is evaluated in the feature space defined by a FOIs' NDVI time-series, but in principle any other signal can be used. Marker evaluates the Euclidean distance between signals of two FOIs and using the following equation:
where and represent NDVI values for FOIs and on date , respectively. The sum runs over all available valid values within crop specific time interval, which is denoted as . If the claim is corn, for example, then the sum runs over all valid values between May 15 and September 15, and if in the case of winter wheat, claim the sum runs over all valid values between April 15 and August 15. These intervals were optimized to maximize the differences between different crop types. Left (right) figure below illustrates calculation of a distance between a FOI with a claim to grow corn and another FOI from its neighborhood with a claim to grow corn (winter wheat). The red arrows show in both figures the difference between NDVI values, , for all dates that enter the calculation of the distance between these pairs of FOIs. The shorter the red arrows are, the shorter the Euclidean distance between the pair of FOIs.
| Distance between a FOI(corn) and a FOI(corn) | Distance between a FOI(corn) and a FOI(winter wheat) |
|---|---|
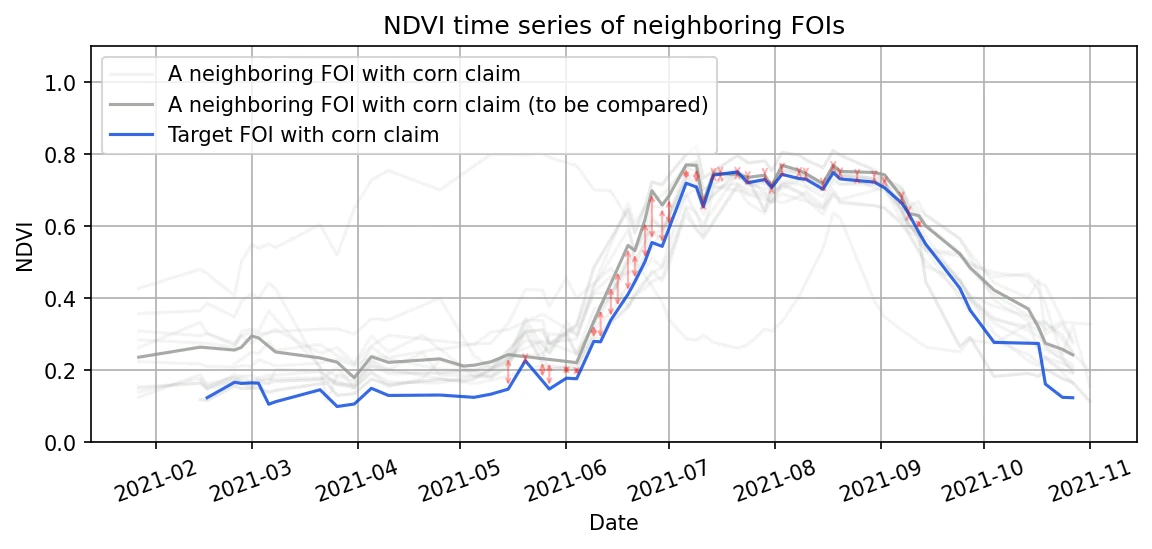 | 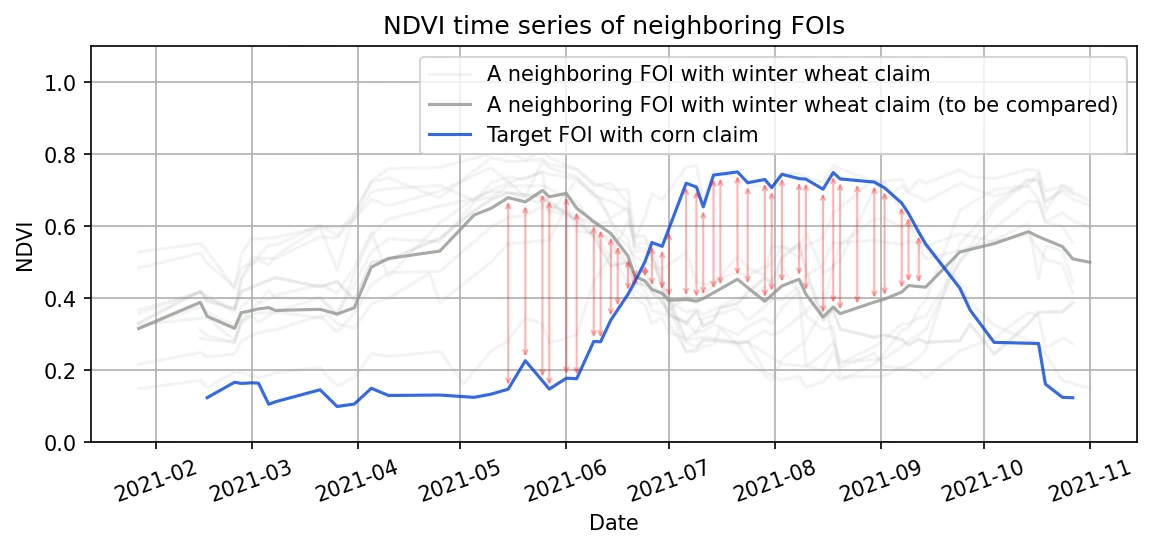 |
The above explanation describes how Euclidean distance metric between NDVI signals of pair of FOIs is calculated. The distance marker score of a target FOI for crop hypothesis is calculated in the following way:
- Identify up to 500 (configurable) FOIs claimed to grow crop in the neighborhood of target FOI. Neighborhood is limited to the same hexagon or hexagon plus a ring of neighboring hexagons as described above. This is configurable.
- Calculate Euclidean distances as described above for all pairs of target FOI and a neighboring FOI with crop claim X.
- Calculate average distance between the target FOI and neighboring FOIs with crop claim X. Average distance represents the distance marker score and is calculated for all possible crop hypothesis.
- Transform distance marker scores in such a way that a distance score distribution for crop of all FOIs with a claim to grow crop is a flat distribution between 0 and 100. This is done in the same way as in the case of similarity marker.
Links
Blog post about Similarity and Euclidian distance marker
Examples